


Abstract
The manila clam, Ruditapes philippinarum, is an important bivalve species in worldwide aquaculture including Korea. The aquaculture production of R. philippinarum is under threat from diverse environmental factors including viruses, microorganisms, parasites, and water conditions with subsequently declining production. In spite of its importance as a marine resource, the reference genome of R. philippinarum for comprehensive genetic studies is largely unexplored. Here, we report the de novo whole-genome and transcriptome assembly of R. philippinarum across three different tissues (foot, gill, and adductor muscle), and provide the basic data for advanced studies in selective breeding and disease control in order to obtain successful aquaculture systems. An approximately 2.56 Gb high quality whole-genome was assembled with various library construction methods. A total of 108,034 protein coding gene models were predicted and repetitive elements including simple sequence repeats and noncoding RNAs were identified to further understanding of the genetic background of R. philippinarum for genomics-assisted breeding. Comparative analysis with the bivalve marine invertebrates uncover that the gene family related to complement C1q was enriched. Furthermore, we performed transcriptome analysis with three different tissues in order to support genome annotation and then identified 41,275 transcripts which were annotated. The R. philippinarum genome resource will markedly advance a wide range of potential genetic studies, a reference genome for comparative analysis of bivalve species and unraveling mechanisms of biological processes in molluscs. We believe that the R. philippinarum genome will serve as an initial platform for breeding better-quality clams using a genomic approach.
Introduction
The seawater bivalve Ruditapes philippinarum, known as the manila clam or short-necked clam is a most important aquaculture species, having great commercial value and a worldwide distribution. Global production of cultured or farmed bivalve molluscs is ∼16.1 million tons per year, accounting for 22.8% of global freshwater aquaculture production in 2015 (FAO 2016). The R. philippinarum is largely distributed on the southern shores of the Korean Peninsula and is one of the important marine resources which determines the production rate of shellfish on the west coast in South Korea. China is the largest producer of manila clam followed by Japan and South Korea. The consumption of manila clam accounts for 0.175 kg per person per year and the consumption rate is increasing alongside its aquaculture production since 1991 in South Korea. However, exogenous influences such as infections by virus, bacteria, and perkinsus parasite and increasing water temperature have become major threats for this species especially in aquaculture production (Beaz-Hidalgo et al. 2010; Dang et al. 2009; Kim et al. 2008; Paillard et al. 2004). Remarkably, the occurrence of perkinsosis is considered as an inveterate problem in South Korea, where dramatic drop in aquaculture production has ensued (Park et al. 2006, 2010). Thus, the genome survey for R. philippinarum is needed for further comparative and functional studies of bivalve species and their production.
The completion of the pearl oyster genome sequence has accelerated studies on the genomes of other members of the bivalve family (Takeuchi et al. 2012, 2016; Zhang et al. 2012). To date, genomic and transcriptomic analysis of many other bivalve species focusing on the identification of candidate genes related to immunological defense (Ertl et al. 2016; Moreira et al. 2012; Nam et al. 2016; Rao et al. 2015), response to benzo (a) pyrene toxicity (Liu et al. 2014b), shell color (Yue et al. 2015), reproduction (Li et al. 2016; Patnaik et al. 2016; Teaniniuraitemoana et al. 2014), and environmental stress (Milan et al. 2011) in order to understand the biological mechanisms involved in the above factors. Recently, transcriptome analysis of R. philippinarum using 454 pyrosequencing technology revealed putative members of immunological defense genes involved in complement cascades, apoptosis, and the toll like signaling pathways (Moreira et al. 2012).
The lack of genomic resources coupled with poor understanding of molecular and biochemical processes have hindered advances in aquaculture productivity of marine bivalves. Understanding gene functions and their effects on phenotypes will be fundamental for selective breeding programs and disease control. Likewise, the whole-genome assembled data are essential in order to identify trait-specific loci using GWAS and for genomic selection breeding approaches. To this end, whole-genome sequencing has been conducted in several molluscs species, including Crassostrea virginica (Gomez-Chiarri et al. 2015), Crassostrea gigas (Gerdol et al. 2015), Lottia gigantea (Simakov et al. 2013).
In this current study, we sequenced the whole-genome and transcriptome (three tissues) of R. philippinarum, using the Illumina HiSeq 2500 platform. To construct the R. philippinarum whole-genome, we utilized short-insert paired-end (PE) sequencing, long-insert mate-pair (MP) sequencing, and TruSeq Synthetic Long-Read (TSLR) sequencing technologies (McCoy et al. 2014), as marine molluscs frequently show high level of heterozygosity in their genomes (David 1998). Consequently, to improve accuracy of gene prediction, we incorporated R. philippinarum transcriptome data for annotating gene sets in the assembled genome. Our study provides the basic knowledge for understanding genomic features of R. philippinarum and our data will be useful for further comparative, systematic, and functional genomics studies in bivalve species.
Results and Discussion
De Novo Assembly of R.philippinarum
To provide comprehensive genetic information and genomic architecture of R. philippinarum, we used parallel sequencing approaches to build a high-quality de novo assembly using various sizes of sequencing libraries. The DNA samples extracted from four different tissues (mouth, foot, gill, and adductor muscle) were used to construct short-insert PE, long-insert MP libraries and TSLR libraries (McCoy et al. 2014). The PE sequencing with 500 bp insert libraries generated a total of 43.03 Gb sequence data with the Illumina HiSeq 2500 platform. On the basis of a K-mer frequency analysis (K = 17), we estimated the genome size of R. philippinarum was ∼1.37 Gb (see supplementary fig. S1 and table S1, Supplementary Material online). Then, we exploited a combination of two MP libraries (5 and 10 kb) for better de novo assembly. For the 5 and 10 kb long-insert MP libraries, a total of 21.76 Gb and 25.15 Gb high-quality sequencing data, respectively, were produced with a quality score > Q30 (see supplementary table S2, Supplementary Material online). Sequence reads from PE and MP were assembled using SOAPdenovo v2.04 (Luo et al. 2012) into 298,671 scaffolds with an N50 length of 32.7 kb and the gaps in the scaffolds were subsequently filled with the Illumina reads by using GapCloser 1.12 (table 1; Luo et al. 2012).
Statistics of De Novo Assembly for the R. philippinarum Genome
| Ruditapes philippinarum Assembly | No. of Sequences | Total Bases | Longest (kb) | N50 (kb) | N90 (kb) |
|---|---|---|---|---|---|
| Short-read assembly | |||||
| Contig (PE) | 4,861,413 | 2,257,620,557 | 96,344 | 3,333 | 128 |
| Scaffold (PE + MP) | 298,671 | 2,478,800,284 | 474,845 | 32,797 | 5,215 |
| Long-read assembly | |||||
| Contig (TSLR) | 247,445 | 2,206,994,927 | 149,501 | 12,971 | 4,470 |
| Total-read assembly | |||||
| Scaffold (PE + MP + TSLR) | 223,851 | 2,561,070,351 | 572,939 | 48,447 | 7,827 |
| HaploMerger | 13,411 | 1,078,771,101 | 1,050,406 | 119,518 | 39,029 |
Furthermore, to improve the quality and length of de novo assembled scaffolds from PE and MP sequencing data, we applied TSLR technology which is able to generate synthetic long-read data from short-read sequence. As shown in our methods, the key processes for TSLR library construction were adopted using the technique recently introduced in the study of the Botryllus schlosseri genome (Voskoboynik et al. 2013). Four independent TSLR libraries produced 4,303,423 reads covering 11,766,512,411 bp (11.7 Gb) of sequence data (see supplementary table S2, Supplementary Material online). A total of 894,934,711 reads produced by PE and MP sequencing were assembled into 247,445 TSLR contigs. Finally, the assembled whole-genome of 2.56 Gb for R. philippinarum was anchored by reconstructing TSLR data of 223,851 scaffolds with N50 length of 48.4 kb using SSPACE-LongRead v1.1 (table 1; Boetzer and Pirovano 2014). Hence, with an enormous sequencing data (101,720,272,499 bp) from three types of library construction allowed us to improve R. philippinarum de novo genome assembly and thus a high coverage (around 39.7× depth) of the whole-genome was obtained.
Heterozygous Features in the R.philippinarum Genome
In spite of preparing high quality data, our results were not likely to satisfy N50 length for a whole-genome assembly due to the high frequency of heterozygosity in the R. philippinarum genome. The K-mer analysis of R. philippinarum genome exhibited two major peaks, which indicates a high rate of heterozygosity (see supplementary fig. S1, Supplementary Material online), similar to the Ciona savignyi genome (Small et al. 2007). Heterozygosity is a common feature in most eukaryotic organisms and generates sequencing assembly error due to single-nucleotide polymorphisms and micro-insertion or deletions between heterozygous alleles. To better understand sample sequencing quality and contamination, we performed taxonomy profiling with assembled contigs and scaffolds against NCBI taxonomy database (Altschul et al. 1990; Federhen 2015). Approximately 86% of the aligned sequences against NCBI nt database were identified in six clams belonging to marine bivalve mollusk (see supplementary fig. S2, Supplementary Material online). Forty-five percent of assigned sequences were correctly matched to given sequence data for manila clam in NCBI nt database (Taxon ID: 129788). To decrease the complexity of the R. philippinarum genome by heterozygosity, we made an attempt to alternatively reconstruct de novo assembly using HaploMerger (Huang et al. 2012). This approach has provided slightly better assembly results giving a scaffold N50 length of 119.5 kb (13,411 scaffolds), greater than the earlier assembly results because excessive differences between alleles were discounted as false assembly structure. We thus obtained ∼1.07 Gb size of the assembled R. philippinarum genome, close to the estimated genome size (1.37 Gb; table 1 and see supplementary table S1, Supplementary Material online). This result supports fairly high heterozygosity rate in the R. philippinarum genome. However, here, we adopted the assembly data using SSPACE-LongRead v1.1 for further comprehensive genetic analyses of R. philippinarum genome as we wished to avoid spurious merging of contigs in the genome by Haplomerger.
Repeat Composition and Simple Sequence Repeat (SSR) Discovery
To investigate repeat composition in the R. philippinarum genome, we examined repeat components through homology and de novo-based approaches. First of all, we identified a total of 26.38% of repeats (e.g., transposable elements) in the genome using the RepeatMasker program (Smit and Green 1996–2010). However, 17.09% of numerous regions in the genome were sorted as unclassified or unknown repeats. Around 5.09% and 3.44% of the genome are classified into DNA transposons and retrotransposons, respectively. Comparatively, rolling-circle (RC) transposons belonging to DNA transposons are the most abundant repeats (3.01%) in the R. philippinarum genome (see supplementary table S3, Supplementary Material online). We further investigated the features of SSRs in order to provide the basis data for polymorphic information of clam and also to suggest molecular marker candidates. On the basis of the screening results, dinucleotide repeats showed high frequency as 156,972 copies and accounted for 61.29 percentage per million bases. In contrast, the number of each hepta to deca-nucleotide repeat is shown around <100 copies (see supplementary table S4, Supplementary Material online). Among dinucleotide repeats, the highest frequency (109,191 copies) was AT (AT/TA) motif and the lowest frequency (1,102 copies) was CG (CG/GC) motif. In trinucleotide repeats, we were able to observe high occupancy of the (A + T)-rich motif including the combinations with AAT, AAG, AAC, ATG, and AGT (see supplementary table S5, Supplementary Material online). The (A + T)-rich motifs are around 20 times higher than the (C + G)-rich motifs. The AAT (AAT/ATA/TAA/ATT/TTA/TAT) motifs are highly distributed among the genome which accounting for 44.27% among trinucleotide repeats. On the basis of these data, we identified a total of 7,368 primers for SSR targets, which can be used for further polymorphism screening across the congener species of R. philippinarum (see supplementary table S6, Supplementary Material online).
Gene Prediction and Annotation
Leveraging recent advances in NGS technologies, a huge amount of sequencing data is recently accumulated and utilized for extensive researches in evolutionary genetics (Foote et al. 2015). However, in comparison with mammalian genome studies, understanding marine mollusk genome architecture is still in its infancy. Here, we have tried to provide a commendable resource for study of marine bivalve genomics. With repeat-masked genome sequencing data, we accomplished gene prediction and structural-annotation by homology based search prior to determination of gene set with transcriptome data. At first, we sought to comprehensively describe the noncoding RNAs (ncRNA) with the purpose of building better coding gene models. By homology-based Blast search, a total of 240 rRNA copies were matched with 29,746 bp. In addition, 5,360 tRNA copies accounting for 0.02% of its genome were estimated using tRNAscan-SE tool (Lowe and Eddy 1997). The miRNAs with 20,118 copies (2,071,902 bp) and snRNAs with 1,756 copies, respectively were found using INFERNAL (see supplementary table S7, Supplementary Material online; Nawrocki et al. 2015; Nawrocki and Eddy 2013).
To conduct empirical analysis for gene identification and prediction, we used three different gene prediction methods (ab initio, homology-based, and RNA-seq-based annotation) and the results from each method were used for the construction of a final gene set using the Hidden Markov Model (HMM)-based gene prediction program, AUGUSTUS (Stanke et al. 2004). As a result, a total of 108,034 gene models including 1,932 isoforms were predicted as described in the methods section. Among them, 98,442 gene models were supported by our transcriptome data. We further analyzed the entire predicted genes comprised around 21.58% of the genome (552.9 Mb) with 451,049 predicted exons (4.09%) of the genome. Average length of genes was calculated as 5,117 bp. The detail of summary statistics for gene prediction is reported in table 2.
Results of Gene Prediction for the R. philippinarum Genome
| Classification | Quantification |
|---|---|
| Total no. of gene models predicted | 108,034 |
| Unique gene models (no.) | 106,102 |
| Genes with isoforms (no.) | 1,932 |
| RNA-Seq supported gene model (no.) | 98,442 |
| Average gene length (bp) | 5,117 bp |
| Total bases of gene models (Mb) | 552.90 Mb |
| Genes in the draft genome (%) | 21.58% |
| No. of exon | 451,049 |
| Average no. of exon per gene | 4.17 |
| Average exon length (bp) | 232 bp |
| Exons in the draft genome (%) | 4.09% |
| No. of intron | 343,015 |
| Average no. of intron per gene | 3.17 |
| Average intron length (bp) | 1,230 bp |
| Introns in the draft genome (%) | 16.48% |
Gene annotation using Uniprot, NCBI nonredundant (NCBI nr), and InterProScan database were used as sources for protein sequences and also to find its biological functions (Pruitt et al. 2007; Quevillon et al. 2005; UniProt 2015). Among the 108,034 gene models 45,595, 70,136, and 70,061 genes were predicted by the Uniprot, the NCBI nr, and the InterProScan database, respectively. Consequently, 80,449 gene models (74.47%) were annotated with respective gene identifiers and 44,569 gene models (41.25%) were common on all three identifiers (see supplementary fig. S3, Supplementary Material online). Here, we first reported the consensus gene sets of R. philippinarum which are predicted with highly accurate de novo genome assembly data. Over 91% of the predicted gene models were verified by comparing with transcriptome data obtained from three different tissues. These results could be useful for the ecological and immunological studies of infectious disease in marine environments and also provide a better understanding of the evolutionary relationship between bivalve molluscs.
Comparative Analysis of Orthologous Gene Families
To investigate the detailed gene annotation of R. philippinarum, we performed orthologous gene clustering analysis of all predicted R. philippinarum genes with oyster, snail, octopus, drosophila, lancelet, mouse, and human. Notably, we found that R. philippinarum genome contains 4,605 orthologous gene families. Among them, 3,033 orthologous gene families are shared with all seven genome and 154 gene families were annotated only in the R. philippinarum genome (see supplementary table S8, Supplementary Material online). In addition, we identified highly enriched gene families in the R. philippinarum genome by comparing with the other genomes. We found a total of 1,042 gene families that represent high copy number of genes in the R. philippinarum genome. To determine the significant expansion of gene families in the R. philippinarum, we selected gene families using defined criteria as described in methods section. Thus, we identified that a total of 62 gene families corresponding to 5,163 gene models contain at least three times higher copy number in the R. philippinarum than other genomes (see supplementary table S9, Supplementary Material online).
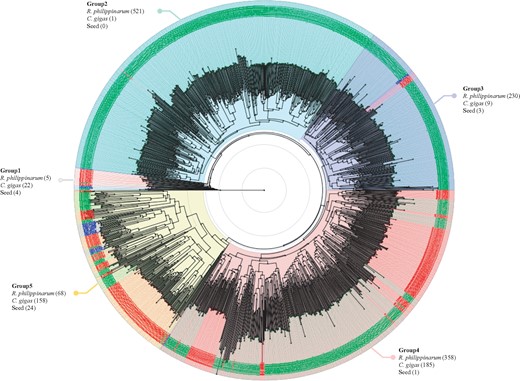
Phylogenetic tree of C1qDC genes. The tree was reconstructed by BLOSUM62 and the Neighbor-Joining methods using the Jalview v2.10.1 program and visualized by using Figtree tool v1.4.3. Each taxon of C1qDC genes in R. philippinarum, C. gigas, and PFam seeds are written in green, red, and blue letter, respectively. A total of 1,589 C1qDC genes were used for this analysis and divided into five groups. The number in brackets indicates the number of C1qDC genes in R. philippinarum, C. gigas, and PFam seeds, clustering to each group.
We also further investigated the relevant gene ontology (GO) categories of these expanded 62 gene families based on predicted PFam entries (Mitchell et al. 2015). Of the 62 gene families, 22 gene families are matching with at least one GO term. Considering cellular components, three gene families such as opioid growth factor receptor (OGFr, GO:0016020, 29 genes), interferon-inducible GTPase (IIGP, GO:0016020, 145 genes), and interleukin-17 (IL-17, GO:0005576, 43 genes) were only identified as components of membrane and extracellular region. Twenty-two gene families were corresponding to 17 GO terms of molecular function and the most represented group was related with DNA binding activity (GO:0003677) such as helix-turn-helix (HTH), RNA polymerase II transcriptional coactivator p15 also known as positive cofactor 4 (PC4), transposase, and phage integrase family. Within the biological process classification, 15 out of 62 gene families were correlated with 14 GO categories (see supplementary fig. S4, Supplementary Material online).
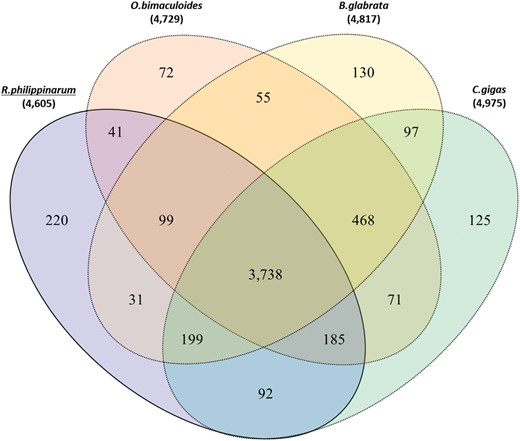
Orthologous gene clusters in the Mollusca lineage. Venn diagram shows the number of unique and shared gene families among the four Mollusca genomes (manila clam, octopus, snail, and oyster).
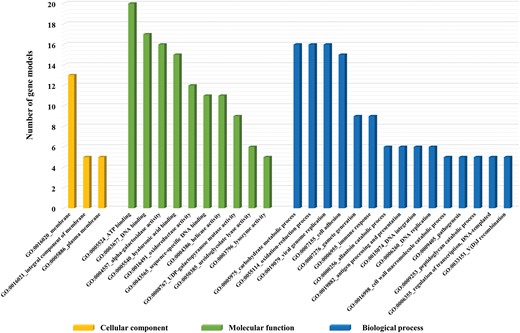
Gene ontology (GO) categories of unique gene families in R. philippinarum among four Mollusca. The functions of 68 gene families were classified and subdivided into a total of 93 GO terms. However, the majority of gene families is only represented in this figure as follows three main categories: Cellular components (yellow), molecular function (green), and biological process (blue). The x axis denoted the related functional categories and the y axis denoted the number of gene models, which are associated with each GO categories.
Whole-Transcriptome Analysis
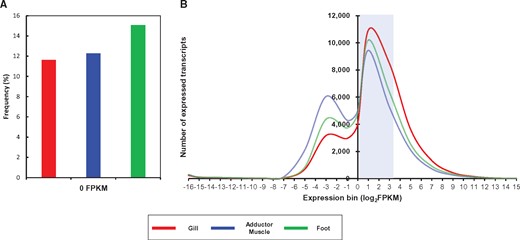
Bioinformatic analysis for transcript expression profile. (A) Frequency of transcripts with 0 FPKM in each tissue. (B) Distribution of FPKM values for transcripts expressed in each tissue. The x axis and y axis indicate the number of expressed transcripts and log-transformed FPKM values of transcripts (FPKM > 0) from three tissues, respectively. The blue box denotes the majority of transcripts (1 < FPKM < 10).
Summary of Whole Transcriptome Analysis and Unigene Construction
| Tissue | Total RNA Reads | Filtered RNA Reads (%) | GC Rate (%) | Assembly Result | Expressed Transcript (FPKM > 0) | Expressed Transcript (FPKM > 1) | Predicted Transcripts | |||
|---|---|---|---|---|---|---|---|---|---|---|
| Nonredundant Unigenes | Average Unigenes Length | Unigene N50 (bp) | Gene | |||||||
| Gill | 67,441,250 | 62,923,824 (93.3) | 37.63 | 199,345 | 882 | 1,600 | 132,766 | 144,535 | 112,061 | 66,879 |
| Adductor muscle | 81,677,808 | 75,874,878 (92.9) | 38.92 | 111,441 | 64,844 | |||||
| Foot | 67,685,344 | 62,907,532 (92.9) | 37.49 | 108,559 | 73,058 | |||||
Materials and Methods
Ruditapes philippinarum Sampling and Nucleic Acid Sample Preparation
We collected healthy R. philippinarum samples in July, 2015 from a tidal flat farm in western sea of South Korea (36°53′21.3″N 126°22′00.6″E). We collected ∼1.5-year-old R. philippinarum samples by measuring morphometric characteristics such as shell length (32–33.5 mm) and weight (7–8 g). The collected R. philippinarum samples were dissected and frozen immediately.
The nucleic acids were extracted from two R. philippinarum adult individuals for sequencing library preparation of whole-genome and transcriptome, respectively. The dissected tissues were frozen in liquid nitrogen and homogenized. DNA was extracted from four tissues including mouth, gill, adductor muscle, and foot using Qiagen DNeasy Blood & Tissue Kit (Qiagen, Germany) according to the manufacture’s protocol. Extracted DNA was measured by Quant-iT BR assay kit (Invitrogen). Total RNAs were independently extracted from gill, adductor muscle, and foot using Trizol reagent (Invitrogen, USA). In order to increase purity and prevent genomic DNA contamination, we carried out RNA purification using RNeasy Mini Kit (Qiagen). Then, the quality of RNAs was checked by 28S/18S ratio, and RNA integrity number (RIN) value using TECAN Infinite F200 and Agilent Bioanalyzer 2100 system. All RNAs extracted from each three tissue shows 6.7–6.9 RIN values.
Whole-Genome Sequencing Library Construction
PE, MP libraries were prepared following the manufacturer’s instructions. For short-read sequencing libraries, high-molecular weight genomic DNA was sheared to ∼500 bp for PE, whereas 5 kb, and 10 kb for MP libraries using a Covaris S2 Ultrasonicator system. All DNA sequencing libraries were constructed according to Illumina’s guideline. To confirm library construction, we ascertained the right size of libraries by using a 2200 TapeStation (Agilent Technologies, CA, USA). Normalization of libraries was diluted with hybridization buffer then the clusters of each library were generated on a cBot System (Illumina) by using HiSeq Rapid Duo cBot Sample Loading Kit (Illumina). Final library products were sequenced on the Illumina HiSeq 2500 using the HiSeq Rapid Paired-End Cluster Kit v2 and SBS Kit v2 (Illumina) for 100 PE sequencing.
Synthetic Long-Read DNA Library
The synthetic long-read DNA library preparation was constructed according to the general protocol of TSLR DNA Library Prep Kit (Illumina). We digested genomic DNA into 8–10 kb fragments in g-Tube (Covaris). These fragments then went through end-repair and ligation of amplification adapters, before being diluted onto 384-well plates so that each well contains DNA representing ∼1–2% of the genome (∼200 molecules, in the case of R. philippinarum). Long-range PCR was used to amplify molecules within wells, followed by highly-parallel Nextera-based fragmentation and barcoding of individual well. Then, DNAs from every well were pooled from 384-well plate into a single sample, cleaned, and concentrated in order. The pooled long-read DNA libraries were conducted to check the right size pattern on a 2200 Tape Station (Agilent Technologies, CA, USA). To initiate whole-genome sequencing, the diluted libraries were under cluster generation on the cBot system (Illumina). A fully loaded flow cell was sequenced on a HiSeq 2500 (Illumina) using the HiSeq SBS and Cluster Kit v4 for 200 cycles.
Raw Sequencing Read Filtering for De Novo Assembly
In order to secure high quality sequence reads of all sequencing libraries, we filtered out of the raw read according to criteria below.
1) Reads with ambiguous bases (represented by the letter N) or poly-A structure contents.
2) Reads with ≥40% low-quality bases (base quality ≤7) from 500 bp insert size library and reads with ≥60% low-quality bases from large insert size libraries.
3) Reads with adapter contamination: Reads with ≥10 bp aligned to the adapter sequence were filtered out (no >3 bp mismatch allowed).
4) Small insert size reads in which read1 and read2 overlapped by ≥10 bp (only 10% mismatch allowed).
5) PCR duplications (reads were considered duplicates when read1 and read2 of the two PE reads were identical).
De Novo Assembly of the R.philippinarum Genome
Prior to R. philippinarum genome assembly, we estimated its genome size based on K-mer analysis with K-mer size of 17-bp using SOAPec v2.01 Tool. The genome size was calculated using the following formula (Genome Size = Total number of K-mer/K-mer depth). The size of R. philippinarum genome was estimated at around 1.37 Gb (see supplementary fig. S1 and table S1, Supplementary Material online).
With only qualified reads from PE and MP libraries, the R. philippinarum genome was assembled with contig construction followed by scaffolding, and gap closure. In the contig construction, the short insert library (500 bp) data were assessed to construct a de Brujin graph using SOAPdenovo software v2.04 with default parameters (Luo et al. 2012). Then, we discarded all erroneous data such as the clip tips, bubbles, and connection with low coverage. All qualified reads were realigned with the contig sequences. Then, we calculated the PE relationship between each pair of contigs and built the scaffolds step by step, from short insert-size to long distance PEs. The synthetic long read data were also used to promote long-range scaffolding of de novo assembly. Sequence reads generated from the synthetic long-read libraries were assessed to construct the TSLR contigs using TruSeq Long-Read Assembly tool v1.1 with default parameters (McCoy et al. 2014). Consequently, the reconstruction of scaffolds with the underlying scaffolds and TSLR contigs was conducted with SSPACE-LongRead v1.1 with default parameters (Boetzer and Pirovano 2014). Finally, the gaps between the scaffolds, mainly derived from repeats, were covered with the high quality PE information by using GapCloser tool v1.12 with default options (Luo et al. 2012). The significant heterozygosity in the R. philippinarum genome was likely to present assembly errors. In addition, we tested alternative assembly methods with default parameters, HaploMerger2 v 20151124 software, to counteract those issues of high level of heterozygosity in the R. philippinarum genome (Huang et al. 2012).
Taxonomy Profiling
All assembled genome data were subjected to perform nucleotides sequence alignments with NCBI nr nucleotide database (Blast v2.2.29) by using megablast algorithm with an E-value cutoff of 1E–5 (Altschul et al. 1990). Next, taxonomy assignments by using aligned contigs and scaffolds were performed with the empirical taxonomy information from NCBI database (Federhen 2015). The visualization of taxonomy profiling were conducted with the Krona tool v2.5 (Ondov et al. 2011).
Repeats Identification
To identify precise repeats in R. philippinarum genome, we applied two repeat-masking approaches including homology-based and de novo-based. The homology-based repeat search was processed with RepeatMasker software (v4.0.6) using Repbase libraries representing known repeats (Smit and Green 1996–2010). De novo repeat identification and modeling were finished by repeat finding program, RepeatModeler v1.0.8 (Price et al. 2005). SSRs were identified by using perl script on simple sequence repeat identification tool (SSRIT) (ftp://ftp.gramene.org/pub/gramene/archives/software/scripts/ssr.pl) in the R. philippinarum genome. SSR target primer pairs were designed with flanking sequences of SSR by using Primer 3 program with the following criteria (GC contents > 50%; product size range in 150–200 bp; annealing temperature range in 55–62 °C; primer length 18–26 bp in size; Untergasser et al. 2012).
Prediction of ncRNAs
From de novo assembled R. philippinarum genome, four types of ncRNA, microRNAs (miRNAs), transfer RNAs (tRNAs), ribosomal RNAs (rRNAs), and small nuclear RNAs (snRNAs), were detected by searching databases. tRNAscan-SE with default setting was used to search for reliable tRNA positions (Lowe and Eddy 1997). To detect snRNAs and miRNAs, INFERNAL v1.1.1 was implicated in searching for putative sequences with the Rfam database (release 9.1; Nawrocki et al. 2015; Nawrocki and Eddy 2013). For rRNA predictions in the R. philippinarum genome, BLAST was performed which is a homology search method (Altschul et al. 1990).
Genome Annotation
Ruditapes philippinarum genome annotation was performed using a combination of evidence-based gene prediction (RNA-seq and proteins) and ab initio gene prediction. First, transcript alignment was performed on the repeat masked genome data based on Tophat2 with default options (Kim et al. 2013). The aligned results with transcript data were implicated in prior gene prediction by using GeneMark-ET tool (v4.29; Hoff et al. 2016). Next, homologous proteins of other species were mapped to the genome using TBlastN (Blast v2.2.29) with an E-value cutoff of 1E–5 and the aligned protein sequences were implicated in prediction of the gene region using Exonerate tool v2.2.0 with default parameters (Altschul et al. 1990; Slater and Birney 2005). A final gene set of R. philippinarum was decided by using AUGUTUS tool v3.2.1 with default setting (Stanke et al. 2004). Gene functions were assigned according to the best alignment attained using BLASTP to the UniProt database (E-value cutoff of 1E–5) and INTERPRO v5.17 scan.
Phylogenetic Analysis for C1qDC Genes
We collected C1qDC genes from the R. philippinarum and C. gigas genomes, and used the Pfam seed alignment sequences of C1q gene family (PF00386) as their conserved sequences (Finn et al. 2016). Next, the ClustalW2 multiple alignment program was used to generate the multiple amino acid sequence alignment of the C1q domain gene using default option (Larkin et al. 2007). Through the Jalview v2.10.1 program, the conserved domains of the C1q gene were selected based on the Pfam seed alignment sequences and the phylogenetic tree was constructed with the BLOSUM62 and the Neighbor-Joining methods (Waterhouse et al. 2009). The generated tree was finally visualized by using FigTree tool v1.4.3 (http://tree.bio.ed.ac.uk/software/figtree/).
Transcriptome Sequencing
In order to construct cDNA library for RNA sequencing, mRNA was enriched by oligo-dT attached magnetic beads from a total 2 µg of RNA. Then, the purified mRNAs were sheared into short fragments and synthesized to double-stranded cDNA by reverse-transcription, immediately. Synthesized cDNA was subjected to end-repair, poly-A addition, and connected with 5′ and 3′ adaptors on both ends using the TruSeq RNA sample prep Kit (Illumina, CA). Modified mRNA fragments were separated on bluepippin 2% agarose gel cassette and the suitable fragments were automatically purified and used as templates for PCR amplification. The final products were 400–500 bp in length and were evaluated by Agilent High Sensitivity DNA kit (Agilent Technologies, USA) on the Agilent Bioanalyzer 2100 system. Subsequently, constructed libraries were sequenced using an Illumina HiSeq 2500 sequencer (Illumina, USA). All processes were conducted by TheragenETEX Bio Institute (Suwon, South Korea).
Analysis of Transcriptome Data
Prior to mapping and assembly, the raw reads were evaluated by sequence quality score, GC content, and duplicate sequences. Raw reads filtered through in-house scripts by these criteria: First, reads including >10% of skipped bases, second, reads including >40% of bases whose quality score is <20%, third, their average quality score is <20. In addition, sequences under quality score 20 in both ends of filtered reads were also discarded due to increasing assembly quality (Martin and Wang 2011). On the basis of high-quality reads, de novo transcriptome assembly was performed using the short-read assembly software Trinity (Grabherr et al. 2011) and assembled contigs were processed with clustering using TGICL (Pertea et al. 2003) and CAP3 (Huang and Madan 1999) for unigene construction. To understand characterization and function of unigenes, coding sequence (CDS) was predicted by TransDecoder (Haas et al. 2013) and DNA and protein sequence homology searching was conducted by NCBI BlastX (2.2.28+) and InterProScan v5 (Quevillon et al. 2005).
To quantify the gene expression across three tissues, we measured the expression of unigenes with fragments per kilobase of exon per million fragments (FPKM) and calculated expression levels by CUFFLINKS with default parameters (Li and Dewey 2011). We inspected the FPKM distribution of all transcripts across samples and selected the highly expressed transcripts in each tissue. Further, clustering analysis was performed using the FPKM values followed by the heatmap was constructed using pheatmap R package (v1.0.8, available at http://cran.r-project.org/web/packages/pheatmap/index.html) with the popular clustering distance (euclidean) and hierarchical clustering method (complete) functions.
Supplementary Material
Supplementary data are available at Genome Biology and Evolution online.
Authors’ Contributions
SM, YJK, JY, HA, and KH designed the study, performed sample collection, and drafted the manuscript. SO, WS, and JW processed samples. SM, YJK, and KM analyzed and interpreted the data. All authors read and approved the final manuscript.
Acknowledgements
This study was supported by grants from the National Marine Biodiversity Institute of Korea (2015M00500). We also thank the associate editor and the two anonymous reviewers for their critical evaluation and valuable suggestions for our manuscript.
Literature Cited
Author notes
Associate editor: Richard Cordaux
Data deposition: The data can also be accessed through BioProject accession number PRJNA352642 for the whole-genome and transcriptome sequencing data. All the raw sequence data have been deposited in NCBI’s Sequence Read Archive (SRA) with BioSample accession number SAMN06027796 and are accessible through SRA accession number SRR5100219–5100254.
