


Abstract
Procellariiform seabirds rely on their sense of smell for foraging and homing. Both genomes and transcriptomes yield important clues about how olfactory receptor (OR) subgenomes are shaped by natural and sexual selection, yet no transcriptomes have been made of any olfactory epithelium of any bird species thus far. Here, we assembled a high-quality genome and nasal epithelium transcriptome of the Leach’s storm-petrel (Oceanodroma leucorhoa) to extensively characterize their OR repertoire. Using a depth-of-coverage-assisted counting method, we estimated over 160 intact OR genes (∼500 including OR fragments). This method reveals the highest number of intact OR genes and the lowest proportion of pseudogenes compared to other waterbirds studied, and suggests that rates of OR gene duplication vary between major clades of birds, with particularly high rates in passerines. OR expression patterns reveal two OR genes (OR6-6 and OR5-11) highly expressed in adults, and four OR genes (OR14-14, OR14-12, OR10-2, and OR14-9) differentially expressed between age classes of storm-petrels. All four genes differentially expressed between age classes were more highly expressed in chicks compared to adults, suggesting that OR genes may exhibit ontogenetic specializations. Three highly differentially expressed OR genes also had high copy number ratios, suggesting that expression variation may be linked to copy number in the genome. We provide better estimates of OR gene number by using a copy number-assisted counting method, and document ontogenetic changes in OR gene expression that may be linked to olfactory specialization. These results provide valuable insight into the expression, development, and macroevolution of olfaction in seabirds.
Introduction
It is widely recognized that vertebrates use scent cues to discriminate food, mates, relatives, offspring, predators, diseases, territories, and that the sense of smell is involved in many other important biological functions crucial for survival and reproduction. Yet, the sense of smell has rarely been investigated comprehensively in birds, and has historically been dismissed as unimportant by ornithologists (reviewed in Zelano and Edwards 2002; Balthazart and Taziaux 2009; Potier 2020). However, emerging evidence shows that many birds have well-developed olfactory abilities that likely rival many mammals (Bang 1966; Bonadonna and Nevitt 2004; Nevitt et al. 2008; Corfield et al. 2015; Wikelski et al. 2021).
In vertebrates, the ability to detect and differentiate tens of thousands of odorants is largely mediated by olfactory receptors (ORs), which are mainly expressed in the olfactory epithelium of the nasal cavity (Buck and Axel 1991). ORs are transmembrane G protein-coupled receptors (GPCRs) with seven α-helical transmembrane domains bound to a G-protein. The binding of extracellular ligands to ligand-binding sites of ORs triggers conformational changes that lead to intracellular signaling cascades, resulting in signal transmission to the olfactory bulb in the brain (Fredriksson et al. 2003), which ultimately leads to olfactory perception. It has been proposed that different types of ligands are recognized by different combinations of ORs to enable an individual to perceive thousands of chemicals as distinct odors (Malnic et al. 1999). The large number of ORs in vertebrates are classified into two groups. Class I ORs are hypothesized to bind water-borne hydrophilic ligands, and class II ORs appear to bind airborne hydrophobic ligands (Mezler et al. 2001).
ORs are encoded by OR genes, which, at approximately 900 bp in length, lack introns and are relatively short (Niimura 2012). OR genes are the largest multigene family in vertebrates (Nei et al. 2008). Moreover, frequent gains and losses through duplication and pseudogenization have resulted in dramatic differences in OR repertoire and gene number between species (Nei et al. 2008; Niimura 2012). New OR families likely originate through gene duplication and positive selection, leading to neofunctionalization and species-specific adaptations, whereas loss of function of some gene duplicates typically results in large numbers of OR pseudogenes (Innan 2009). The number of intact OR genes ranges from 40 in pufferfish Fugu rubripes (Niimura and Nei 2005) to ∼2000 in the African elephant Loxodonta africana (Niimura et al. 2014). The overall size and diversity of the OR repertoire across species is believed to be influenced by ecological adaptation and reliance on olfaction (Gilad et al. 2004; Hayden et al. 2010). Highly olfactory mammals such as elephants have many intact OR genes compared to primate species, such as humans, chimpanzees, and macaques (<400 intact OR genes). Primates are thought to rely more on vision than olfaction and their genomes have a smaller number of intact OR genes (Matsui et al. 2010; Niimura et al. 2014).
The OR repertoires of birds are small relative to many other vertebrates, and gains, losses, and pseudogenization seem to play important roles in their evolution (Organ et al. 2010; Khan et al. 2015). Ecological factors and life-history adaptations appear to have shaped the olfactory abilities and OR repertoire variation among birds of prey, water birds, land birds, and vocal learners (Corfield et al. 2015; Khan et al. 2015). Although there was an expansion in OR family 14 (the γ-c clade) in birds and the majority of avian OR genes belong to this family, some bird species and lineages exhibit alternative patterns of OR gene family expansions or reductions (Khan et al. 2015). For example, the estimated number of OR genes is larger in both the nocturnal brown kiwi (Apteryx australis) and the flightless kakapo (Strigops habroptilus), than in their diurnal relatives (Steiger et al. 2009a). In contrast, penguins, like many aquatic mammals (Hayden et al. 2010), possess a high percentage of OR pseudogenes (Lu et al. 2016), which appears to have been pseudogenized during the transition from a terrestrial to a marine habitat, suggesting that olfactory perception or use changed as well. However, these generalizations are based entirely on genomic datasets, rather than transcriptomes, and macroevolutionary patterns across species have not yet been subjected to rigorous statistical analysis.
Olfactory ability is reflected in the olfactory bulb to brain ratio, which correlates positively with the estimated total number of OR genes in birds (Steiger et al. 2008; Khan et al. 2015). Among extant birds, the Procellariiformes, also called tube-nosed seabirds, which includes the storm-petrels, albatrosses, diving petrels, and shearwaters, have the largest olfactory bulb to brain ratios (Corfield et al. 2015). These seabirds are known for their excellent olfactory ability. Many seabird species use olfactory cues to locate areas for foraging (Nevitt 1999a, 1999b; 2000; Nevitt et al. 1995, 2004, 2008), and several burrow-nesting species use odor to locate their burrow when returning to the colony after offshore foraging trips (Bonadonna and Bretagnolle 2002; Bonadonna et al. 2004). In addition, some species can recognize individual-specific odors (Bonadonna and Nevitt 2004). Olfaction therefore plays a crucial role in survival and communication in this group of seabirds. Given the importance of olfaction and excellent olfactory ability in these birds, they are good candidates for studying the evolution of avian OR genes.
The Leach’s storm-petrel Oceanodroma leucorhoa (recently changed to Hydrobates leucorhous; Vieillot 1818) is a common burrow-nesting procellariiform seabird that is known to use olfaction for foraging, homing, and nest recognition. They are attracted to foraging odors in experimental contexts (Grubb 1972; Nevitt and Haberman 2003), and olfaction likely plays an important role in social communication and individual recognition (O'Dwyer et al. 2008). Their musky smelling plumage is imbued with volatile chemicals that may give them individual olfactory signatures. Adults tend to be faithful to their burrow and to their mate throughout their lifetime (Morse and Buchheister 1977; Sin et al. 2021) and adults can recognize their home burrow based on scent (Grubb 1974). Thus, they are a good candidate procellariiform model to investigate in terms of their OR repertoire.
Here, we sequenced and assembled a high-quality genome of the Leach’s storm-petrel and characterized its OR gene family repertoire, allowing us to measure expansion and turnover in OR gene families in this procellariiform seabird and relatives. Across 29 transcriptomes, we also investigated the expression of OR genes in the olfactory epithelium among male and female adults and chicks, allowing us to compare OR expression between sexes and age classes. In most studies attempting to identify OR genes using genome-mining techniques such as BLAST, the sizes of OR repertoires are likely underestimated because of the collapse of similar OR sequences during assembly (Sudmant et al. 2010; Khan et al. 2015). We therefore also estimated copy number (Sudmant et al. 2010; Malmstrøm et al. 2016) of identified OR sequences in an effort to obtain a more accurate estimate of OR gene number. Whole-genome sequencing is the best approach to study the evolution of this large multigene family (Matsui et al. 2010; Dehara et al. 2012; Niimura et al. 2014; Khan et al. 2015; Vandewege et al. 2016), considering only 20 intact OR genes were identified in the Cory’s shearwater (Calonectris borealis) using cosmid library sequencing (Silva et al. 2020). Although a few seabird genomes have been sequenced (Feng et al. 2020), these genomes generally lack high contiguity (contig N50, 13–47 kbp; scaffold N50, 45–408 kbp) compared to other genomes analyzed thus far. The Northern fulmar (Fulmarus glacialis) genome, the only procellariiform whose OR genes have been analyzed (Khan et al. 2015), has ∼5% missing BUSCO genes (Simão et al. 2015) and is not ideal for the identification of OR genes and estimation of OR gene copy numbers. In addition, the life-history and foraging strategies of Northern fulmars differ from those of Leach’s storm-petrels. Northern fulmars are surface-nesting, which is a derived trait compared to burrow-nesting procellariiform species (van Buskirk and Nevitt 2008). This species also has considerably greater visual acuity than Leach’s storm-petrels (Mitkus et al. 2016). Burrow nesting behavior has also evolved in conjunction with responsiveness to dimethyl sulfide (DMS), suggesting that sensitivity to this compound is likely to be the dominant sense in burrow-nesting species (Nevitt 2008; van Buskirk and Nevitt 2008).
Procellariiform seabirds have well-developed olfactory concha (Bang 1966) where the interaction of ORs with ligands and detection of odors takes place. However, to our knowledge, there is currently no study of OR transcriptomes in birds, including chicken (Gallus gallus) and zebra finch (Taeniopygia guttata). Most OR genes have been identified through comparative genomic techniques using homology searches to annotate protein-coding sequences, but there is typically no experimental data to support whether identified OR genes are actually expressed in the olfactory epithelium in birds. ORs are also expressed in non-olfactory tissues (Pluznick et al. 2009) and in sperm (Spehr et al. 2003). Hence it is possible that some OR genes are not expressed in olfactory epithelium and play no role in the sense of smell. In addition, expression level differences among OR genes and families are unknown even for those genes that are expressed in olfactory tissues. The relationship between expression pattern and function in life-history is also important to understand olfactory-mediated behaviors. For example, OR gene expression may reflect developmental changes or sexual dimorphism in olfactory-mediated behaviors. To study OR expression, we used transcriptome sequencing (RNA-seq) to compare OR gene expression between adults and chicks, and between male and female adult birds, allowing us to identify highly expressed OR genes, and OR genes differentially expressed between age classes.
Materials and methods
Sample collection
We captured Leach’s storm-petrels (n = 10) at Bon Portage Island, Nova Scotia, Canada (43°26′N, 65°45′W), where approximately 50,000 pairs breed annually. The age class (chick or adult) and burrow number of each individual were recorded (Hoover et al. 2018). Approximately 75 μl of blood was taken from one male via brachial venipuncture and stored in a microcentrifuge tube containing Queen’s lysis buffer and was then stored unfrozen at 4°C until DNA extraction for whole-genome sequencing. The anterior olfactory concha and right brain were collected from three adult females, three adult males, and three chicks during August 2015, and were stored in RNAlater at 4°C for a few days until RNA extraction.
DNA extraction and whole-genome sequencing
We isolated genomic DNA using the DNeasy Blood and Tissue Kit (Qiagen, Hilden, Germany) and determined sex of the individual for whole-genome sequencing using published PCR primers (2550F & 2718R; Fridolfsson and Ellegren 1999). We measured DNA concentrations using a Qubit dsDNA HS Assay Kit (Invitrogen, Carlsbad, USA) and performed whole-genome libraries preparation and sequencing following Grayson et al. (2017) on an adult male. In brief, a DNA library of 220 bp insert size was prepared using the PrepX ILM 32i DNA Library Kit (Takara), and mate-pair libraries of 3 and 6 kb insert sizes were prepared using the Nextera Mate Pair Sample Preparation Kit (cat. No. FC-132-1001, Illumina). We then assessed library quality using the HS DNA Kit (Agilent) and quantified the libraries with qPCR prior to sequencing (KAPA library quantification kit). We sequenced the libraries on an Illumina HiSeq instrument (High Output 250 kit, PE 125 bp reads) at the Bauer Core facility at Harvard University. We assessed the quality of the sequencing data using FastQC (Andrews 2010), removed adapters using Trimmomatic (Bolger et al. 2014), and assembled the genome using AllPaths-LG (Gnerre et al. 2011). The completeness of the assembled genome was measured with BUSCO v2.0 (Simão et al. 2015) and the aves_odb9 dataset to search for 4915 universal single-copy orthologs in birds.
RNA extraction and transcriptome sequencing
RNA was extracted from each sampled tissue using an RNeasy Plus Mini kit (Qiagen). The quality of the total RNA was assessed using the RNA Nano Kit (Agilent). Poly-A selection was conducted on the total RNA using the PrepX PolyA mRNA Isolation Kit (Takara). The mRNA was assessed using the RNA Pico kit (Agilent) and used to make transcriptome libraries using the PrepX RNA-Seq for Illumina Library Kit (Takara). The HS DNA Kit (Agilent) was used to assess library quality. The libraries were quantified by performing qPCR (KAPA library quantification kit) and then sequenced on a NextSeq instrument (High Output 150 kit, PE 75 bp reads). Each of a total of 29 libraries (Supplementary Table S1) was sequenced to a depth of approximately 30M reads. Different individuals were used for RNA-seq and for whole-genome sequencing (Supplementary Table S1).
Genome annotation
We annotated the Leach’s storm-petrel genome using MAKER v2.31.8 (Holt and Yandell 2011). We combined ab initio gene prediction with protein-based evidence from 16 other vertebrates (10 birds, 3 reptiles, 2 mammals, and 1 fish species), as well as the transcriptome assembly and TopHat junctions from the Leach’s storm-petrel (Supplementary Table S1). We assembled the storm-petrel transcriptome from 10 tissues of a single individual (Supplementary Table S1) using TRINITY 2.1.1 (Grabherr et al. 2011) and inferred splice junctions using TopHat 2.0.13 (Kim et al. 2013). We functionally annotated the genome to identify putative gene function and protein domains using NCBI BLAST+ and the UniProt/Swiss-Prot set of proteins. We used BLASTP on the list of proteins identified by MAKER with an e-value of 1e-6.
Data analysis
OR gene identification and annotation
We identified OR genes in the Leach’s storm-petrel genome assembly with TBLASTN searches using published intact OR amino acid sequences from Vandewege et al. (2016), Niimura (2009) and the HORDE database (The Human Olfactory Data Explorer). The queries included intact OR genes from 12 species of birds, reptiles, mammals, amphibians, and fish (Supplementary Table S2). We first identified all high-scoring segment pairs (HSPs) with a minimum length of 150 bp and an e-value of <1e−10. We then used BEDTools intersect (Quinlan and Hall 2010) and custom Perl scripts to tile overlapping HSPs and remove redundant BLAST results to produce a set of candidate OR regions in the Leach’s storm-petrel.
Candidate OR regions were manually reviewed to omit spurious (non-OR) hits and to determine if each region represented an intact OR gene, a pseudogene, a truncated OR sequence, or an OR gene fragment. The region spanning ±700 bp to each side of the predicted OR location was used in an online BLASTX search against the NCBI nonredundant database delimited by organism “Aves.” Candidate OR genes were omitted if they had top BLAST hits to non-OR sequences (e.g., other non-OR GPCRs), and coordinates for retained genes were refined based on BLAST hits to other avian ORs.
OR genes were classified as “intact” if they contained start and stop codons, with no internal stops or frameshifts, and as “pseudogenes” if they covered the full coding region but contained internal stops or frameshifts, or had large (>5 amino acids) insertions or deletions within transmembrane regions. Candidate ORs spanning incomplete coding sequences were classified as “truncated” if they abutted a scaffold edge or a gap between contigs, or as an OR gene “fragment” if they had an apparently naturally incomplete coding region that was not at a scaffold or contig edge. “Truncated” or “fragmented OR genes” could also be classified as “pseudogenes” if they contained internal stops or frameshifts; OR genes could also be classified as both “truncated” and “fragmented” (e.g., truncated at one end and fragmented at other).
We performed a second TBLASTN search using the intact Leach’s storm-petrel OR genes as queries to search back against the petrel genome assembly to identify any additional candidate regions that may have been missed in the first TBLASTN search. Candidate regions were compared to the OR genes identified in the first round of BLAST searching with the BEDTools subtract option, requiring 10% overlap. We then used NCBI's conserved domain search to annotate transmembrane regions TM1–TM7.
To identify the genomic positions of intact OR genes, we generated a pseudochromosome-level genome assembly by aligning scaffolds of the Leach’s storm-petrel against the zebra finch genome (version bTaeGut1_v1). The genomes were first soft-masked with the Aves library using RepeatMasker and were syntenically aligned using Chromosemble in Satsuma v3.0. We used chromoMap to visualize the OR gene positions on the Leach’s storm-petrel pseudochromosomes.
Phylogenetic analysis and OR gene family assignments
We used phylogenetic analysis of OR amino acid sequences to compare intact Leach’s storm-petrel OR genes to other avian and reptilian OR genes. The result was primarily used to assign Leach's storm-petrel genes to an OR subfamily. We included intact OR sequences from the American alligator, green anole, chicken, and zebra finch from Vandewege et al. (2016), and waterbirds, including members of Sphenisciformes, Pelecaniformes, Suliformes, Gaviiformes, Phoenicopteriformes, Podicipediformes, and Anseriformes, with assembled genomes and annotated gene models on NCBI (Jarvis et al. 2014) (Supplementary Table S3). Pseudogenes, genes encoded by multiple exons, truncated genes, and partial coding regions (<275 AA) were omitted. We used five non-OR rhodopsin family GPCRs from chicken as outgroups (Niimura 2009). They are alpha-1A adrenergic receptor (ADRA1A), 5′ hydroxytryptamine receptor 1B (HTR1B), somatostatin receptor type 4 (SSTR4), dopamine receptor D1 (DRD1), and histamine receptor H2 (HRH2).
We aligned the sequences with the “einsi” option in MAFFT v. 7.407. We manually reviewed the alignment and removed sequences with large indels (>10 consecutive amino acids). We also removed duplicates and any sequences with >5% uncalled residues (Xs), or >10 Xs in total, unless they were Leach’s storm-petrel OR genes or outgroup sequences. The retained sequences were aligned again with the MAFFT einsi option as described above. The alignment edges were then trimmed to retain only the region spanning transmembrane regions TM1–TM7 for phylogenetic analysis.
We used Prottest3 v.3.4.2 (Darriba et al. 2011) to determine the best-fitting model of amino acid substitution, which was JTT + G + F. The best maximum-likelihood topology was inferred with RAxML v. 8.2.10 (Stamatakis 2014) from 100 searches, each starting from a different random starting tree. Five hundred bootstrap replicates were computed with RAxML, and the bootstraps were plotted on the bestML tree. The bestML + bootstraps tree was then rooted on the chicken non-OR outgroups with ETE3 (Huerta-Cepas et al. 2016). The final tree was visualized in MEGA X (Tamura et al. 2011). Leach’s storm-petrel genes were then assigned to an OR family based on phylogenetic relationships, and genes within each family were sequentially numbered (e.g., OR14-1, OR14-2).
Analysis of OR gene copy number
We calculated the genomic depth-of-coverage (DoC) for each OR gene identified in the Leach’s storm-petrel genome assembly. We then compared each DoC to the genome-wide DoC to determine if any predicted OR genes represented collapsed gene copies in the genome assembly (Sudmant et al. 2010; Malmstrøm et al. 2016). We could then estimate the total expected number of petrel ORs. We first repeatmasked the reference genome assembly with query species “vertebrata metazoa” using RepeatMasker v. 4.0.5 (Smit et al. 2015) with RepeatMasker Library “Complete Database 20160829.” The reads of the 220-bp fragment libraries were trimmed with Trimmomatic v. 0.32 (Bolger et al. 2014) and mapped to the Leach’s storm-petrel genome assembly using BWA v. 0.7.15 (Li and Durbin 2010) with default parameters. SAMtools v. 1.5 (Li et al. 2009) was used to post-process mapped reads and merge output BWA SAM files. Reads that were unmapped or below the minimum mapping quality of “30” were omitted. Duplicates were marked and removed with Picard v. 2.18.9 (https://broadinstitute.github.io/picard/). Per-base depth of coverage was then output with the BEDTools v. 2.26.0 genomecov option.
To incorporate the difference in DoC due to variable GC content for the estimation of OR gene copy number, we used the repeatmasked reference genome to calculate DoC for non-repetitive regions only. We calculated DoC within bins of 1000 bp (approximately the size of an intact OR gene) with at least 98% base (non-N) occupancy. For each bin, we calculated the %GC and the average DoC. Then, we calculated the mean DoC within each bin, and placed bins in categories of 5% GC (e.g., 0%–5%, 5%–10%, 10%–15%). We took the ratio of each Leach’s storm-petrel OR gene DoC and compared it to the estimated DoC for the bins with similar GC content. This DoC analysis could not be performed on other waterbirds because genome coordinates for intact, pseudo- and truncated OR genes are required, but are not provided in Khan et al. (2015).
Validation of the DoC-assisted counting method
To validate the estimation of copy number of OR genes using DoC, we calculated the DoC for 4,599 reference genes from the BUSCO aves_odb9 dataset that are single copy and complete in the Leach’s storm-petrel genome. We used the same method to calculate DoC ratios as for the OR genes, but calculated the mean reference gene DoC along the total gene length (introns + exons, in contrast to OR genes that have only 1 exon). We further validated the DoC-assisted method by estimating the total number of OR genes in the chicken genome (Ggal6; accession no.: GCF_000002315.6), where we expect most OR genes to occur at 1X coverage due to high contiguity and completeness of this chromosome-level genome assembly. We mapped the Illumina reads (PE100bp, NCBI SRA accession SRS926532) for the same individual (Biosample SAMN02981218) back to the Ggal6 assembly and ran the DoC analysis on the mapped reads as above, accounting for GC content, with the exception that OR loci identified by BLAST in the chicken were not manually reviewed to determine whether OR genes were intact, pseudogenized, truncated, or fragmented. We additionally calculated DoC values for the set of annotated OR genes in the Ggal6 genome release, after first filtering annotations to remove redundant annotations (i.e., alternative transcripts for the same gene, or alternative gene models spanning the same region).
Analysis of OR gene family evolution
We used a recently developed Bayesian approach to gene family evolution (Liu et al. 2011) to estimate rates of gene birth and death of Leach’s storm-petrel and other birds. This method is a Bayesian version of the popular package Café (De Bie et al. 2006) but has better statistical properties and is less biased than Café (Liu et al. 2011). Previous analyses of OR gene family evolution in birds (Khan et al. 2015) have relied on squared-change parsimony reconstruction of ancestral states or numbers, an approach that is known to be biased and does not yield estimates of gene birth and death rates across lineages. We first integrated our tip values of partial, intact and pseudogene OR numbers, for both our annotation counts as well as copy number-corrected counts, with those from 48 other genomes (Khan et al. 2015) (Figure 3). Inspecting OR gene numbers on this tree strongly suggests that genome assembly quality increases the number of OR genes detected, in contrast to previous assertions (Khan et al. 2015). Because the Bayesian method is computationally intensive, we reduced the number of OR repertoires analyzed in each analysis, focusing first on the clade of 14 species in the immediate phylogenetic vicinity of Leach’s storm-petrel in the MP-EST species tree estimated from all unbinned loci as presented in Jarvis et al. (2015, clade 1). This clade was rooted at the hoatzin (Opisthocomus hoazin) and included a loon, fulmar, penguin, cormorant, and other close relatives of storm-petrels. To determine if rates of OR gene birth and death differed between avian clades, we also analyzed a second clade (clade 2), consisting of 15 species, spanning mousebirds (Colius) to parrots, falcon, and passerine birds. This comparison is useful as a general comparison of differences in gene birth and death between a passerine-rich clade (5 of 15 species) and one with no passerines. The Bayesian model assumes that rates of gene birth and death (λBD) are similar across gene families (in our case the counts of partial, intact and pseudogenes in the dataset). We ran a total of four Bayesian analyses, each for 10 million generations, using default parameters. For both the annotation counts and DoC-corrected counts for OR numbers, we ran two analyses, one where the birth–death rate, λ, is constant across lineages and one where it is allowed to vary among lineages. Both approaches also yielded an estimate of the posterior distribution of the number of gene families that have expanded or contracted on a given node.
OR gene expression analysis
We assessed the quality of the RNA-seq data using FastQC (Andrews 2010). We performed error correction using Rcorrector and removed unfixable reads using a custom python script (https://github.com/harvardinformatics/TranscriptomeAssemblyTools/blob/master/FilterUncorrectabledPEfastq.py). We next removed adapters and low quality reads (-q 5) using TrimGalore! v0.4 (Krueger 2016). We removed reads of rRNAs by mapping to the Silva rRNA database using Bowtie2 2.2.4 (Langmead and Salzberg 2012) with the –very-sensitive-local option and retained reads that did not map to the rRNA database.
We used RSEM (v1.2.29) (Li and Dewey 2011) to quantify levels of gene expression. We first built an RSEM index for the annotated Leach’s storm-petrel genome and then used RSEM to implement Bowtie2 (v2.2.6) for the mapping of RNA-seq reads to the genome, using default parameters for mapping and expression quantification. Expected read counts per million at the gene level from RSEM were used to represent the normalized expression. We used the normalized counts rounded from RSEM outputs as inputs for differential expression analysis. We then used limma voom (Law et al. 2014) to identify differentially expressed genes between adults and chicks, and between male and female adults, using a 5% false discovery rate (FDR) cutoff. We used GOrilla to perform GO analysis (Eden et al. 2009), using the single ranked list of genes mode and selecting biological process as the ontology type and Homo sapiens as the reference organism. Reported enrichment p-values were FDR-adjusted using the Benjamini–Hochberg method (Benjamini and Hochberg 1995).
Analysis of positive selection on OR families 14, 5, and 6
We detected sites that were under selection by investigating the ratio of the rate of synonymous substitutions to the rate of nonsynonymous substitutions (ω = dN/dS), which may indicate positive selection (ω > 1), neutral (ω = 1), or negative selection (ω < 1). We used the HyPhy package (Pond and Muse 2005) implemented in the Datamonkey webserver (datamonkey.org) to infer potential recombination breakpoints and estimate ω. Since recombination and gene conversion can mislead estimation of selection, we used genetic algorithm for recombination detection (GARD) (Pond et al. 2006) to generate multiple phylogenies based on putative nonrecombinant fragments. We then used single-likelihood ancestor counting (SLAC), fixed effects likelihood (FEL), mixed effects model of evolution (MEME), and fast unconstrained Bayesian AppRoximation (FUBAR) methods implemented in HyPhy, plus an integrated approach that incorporates all sites detected by each method, to infer signals of positive selection. All methods were used with default settings. We used WebLogo (weblogo.threeplusone.com) to visualize the amino acid sequence variation of the transmembrane (TM), intracellular (IC), and extracellular (EC) domains.
Results
Assembly of a Leach’s storm-petrel genome
To improve our genome assembly, we generated three different sequencing libraries and generated 439,914,448 reads from the 220-bp library, 313,504,024 reads from the 3-kb library, and 269,594,574 reads from the 6-kb library. The genome size estimated by AllPaths-LG from k-mers is 1.24 Gb (Supplementary Table S4). The contig N50 is 165.4 kb and the scaffold N50 is 8.7 Mb (Supplementary Table S4). BUSCO scores (Simão et al. 2015) show high completeness of the genome, with 98.0% of single-copy orthologs for birds identified and 94.7% represented by complete coding sequences in the genome (Supplementary Table S4). With the aid of the Leach’s storm-petrel transcriptome assembly, the genome annotation using MAKER identified a total of 15,510 gene models. The genome-wide GC content was 42.1%.
OR genes in Leach’s storm-petrel
We identified 221 candidate OR genes from the initial round of TBLASTN (see OR gene identification/annotation in Materials and Methods). Eight of these genes were not ORs. The second TBLASTN search using all identified intact OR genes as queries identified one additional pseudogene fragment region not found in the initial round of search, yielding 214 OR regions in total (Table 1). Of these 214 OR regions, 61 (28.5%) were intact OR genes, and the remainder included 106 pseudogenes (49.5%), 20 truncated genes (9.3%), and/or 27 gene fragments (12.6%) (Table 1 and Figure 1). Some of the intact OR genes were located close together in clusters on pseudochromosomes 1, 1A, 2, 3, 4, 5, 13, 14, 17, and Z (Supplementary Figure S1).
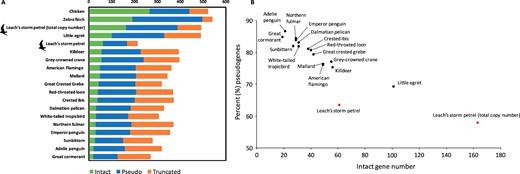
(A) The number of truncated, pseudo-, and intact OR genes in waterbirds, chicken, and zebra finch. (B) The number of intact genes plotted against the percentage of pseudogenes within the same genome in waterbirds. Both the OR gene number estimations based on genome annotation and depth-of-coverage-assisted counting method (total copy number) in the Leach’s storm-petrel are shown. The numbers for all species except the Leach’s storm-petrel are estimated based on genome annotation from Khan et al. (2015).
The number of intact, pseudo-, truncated, and fragment OR genes and their average coverage in the Leach’s storm-petrel genome
| Number of genes | Total copy numbera | (±2 SD)b | Average coverage | |
|---|---|---|---|---|
| Intact | 61 | 163 | (135–219) | 2.7 |
| Truncated | 20 | 51 | (42–68) | 2.6 |
| Total pseudogene | 106 | 224 | (185–299) | 2.1 |
| Pseudogene | 45 | 81 | (68–109) | |
| Pseudogene/fragment | 49 | 103 | (85–138) | |
| Pseudogene/fragment/truncated | 2 | 4 | (3–6) | |
| Pseudogene/truncated | 10 | 36 | (29–46) | |
| Total fragment | 27 | 54 | (38–62) | 2 |
| Fragment | 24 | 48 | (34–56) | |
| Fragment/truncated | 3 | 6 | (4–6) | |
| Total (I + T+P + F) | 214 | 492 | (400–648) | 2.3 |
Refer to the Discussion for the limitation of copy number estimation.
±2 standard deviations (SDs) of the copy number ratio.
To estimate the total number of OR genes, we incorporated the number of collapsed gene copies for the 214 identified OR genes. By calculating the ratio of each OR gene DoC to the estimated DoC for bins of similar GC content across the Leach’s storm-petrel genome (Supplementary Figure S2), we estimated as many as 492 (±2SD = 400–648) predicted OR genes in the Leach’s storm-petrel genome (Table 1). As expected, genes in high GC bins (>50% GC) had lower coverage than genes in low GC bins (<45%; Botero-Castro et al. 2017). The average estimated copy number for intact OR genes was 2.7 and the total number of intact OR genes was 163 (33.1%) (Table 1). The copy number of intact OR genes ranged from 1 to 45 (mean = 2.7, SD = 5.8) (Supplementary Tables S5 and S8). Of the 24 intact OR genes with multiple copies, 13 belonged to OR family 14 (γ-c clade; Khan et al. 2015), which included the intact gene with the highest copy number ratio of 45. The total number of estimated pseudogenes, truncated genes, and gene fragments was 224 (45.5%), 51 (10.4%), and 54 (11%), respectively (Table 1 and Figure 1).
The DoC ratio for 4590/4599 (99.8%) BUSCO single-copy reference genes is 1 (Supplementary Table S9), providing strong evidence that our method for estimating copy number by comparing genic DoC to the DoC value of the associated GC bin is appropriate. Using the same OR identification pipeline as employed for the Leach’s storm-petrel, we identified 549 OR genes in total for the Ggal6 chicken genome assembly. The DoC-assisted counting method estimated that 157 loci have copy number = 0, 385 loci have copy number = 1, and 7 loci have copy number = 2, with values rounded to the nearest integer, yielding a total of 399 ORs. In a second, complementary approach, we applied the DoC-assisted counting method to the set of annotated ORs for the Ggal6 genome assembly (n = 284 loci, reduced to 271 loci after the removal of redundant annotations). DoC-based gene estimates for this set of annotated loci were: 28 loci with copy number = 0, 239 loci with copy number = 1, and 4 loci with copy number = 2, giving 247 estimated OR loci in total.
OR gene family phylogeny
We performed phylogenetic analyses using all intact OR genes from the Leach’s storm-petrel genome and 13 waterbirds, plus ORs from American alligator, green anole, chicken, and zebra finch (Figure 2). We observed a well-supported class 1 clade containing the OR51, 52, and 55 families, but the class 2 genes failed to form a monophyletic clade and the interrelationships among OR families were typically only weakly supported. OR genes largely cluster by OR family, although not always with strong bootstrap support. Despite this occasional low support at higher levels of the topology, we were able to confidently assign 60 of 61 intact storm-petrel ORs to their OR gene family based upon relationships in lower-level clades that typically exhibited much higher bootstrap support (e.g., >80%). The resulting phylogeny implied 10 OR gene families in the Leach’s storm-petrel genome, corresponding to numbers 2, 4, 5, 6, 8, 10, 13, 14, 51, and 52 in chicken. The four light-green branches between OR6 and OR52 were all annotated on NCBI as OR2AT4 and the top hits of their BLASTP results returned as OR2AT4 (Figure 2), it was thus not clear if this might be due to misannotation.
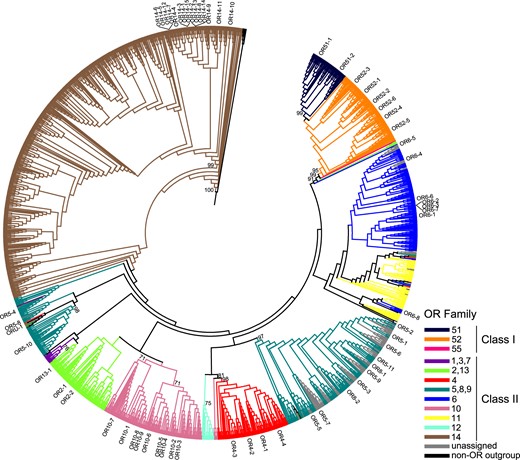
Maximum-likelihood phylogenetic tree showing the relationships among intact ORs. Branches for individual OR sequences are colored according to OR family, and branch lengths are not drawn to scale. Intact OR genes identified in Leach’s storm-petrel are labeled. Percentage support values from 500 bootstrap replicates are indicated for major clades with >70% support.
Macroevolution of OR gene number
We measured rates of OR gene birth and death using the Bayesian model of Liu et al. (2011) across two avian clades and datasets. Clade 1 was rooted at the hoatzin (O. hoazin) and included a loon (Gavia), fulmar (Fulmarus), penguins (Aptenodytes and Pygoscelis), cormorant (Phalacrocorax), and other close relatives of Leach’s storm-petrels. Clade 2 consisted of 15 species spanning mousebirds (Colius) to parrots, falcon and passerine birds, useful as a general comparison of differences in gene birth and death between a passerine-rich clade (5 of 15 species in clade 2) and one with no passerines. When rates of gene birth and death (λBD) were constant across lineages, λBD was estimated to be 0.0152 across the tree (95% CI, 0.0150–0.0154), whether using annotation counts of genes for the clade including Leach’s storm-petrel (clade 1; Figure 3A) or copy number-corrected counts. Using annotation counts, we found that the estimate of λBD was significantly higher for the passerine-rich clade [clade 2; 0.0162; (0.0162–0.0163)] than for clade 1 (Figure 3B). When λBD was allowed to vary across lineages, we found that the estimate for the branch leading to Leach’s storm-petrel [0.0151; (0.0145–0.0154)] was marginally higher than for those of the 13 other lineages in the clade 1 (range of means: 0.00553–0.01453; Figure 3C) when using DoC-corrected OR gene counts, but not when using annotation counts. Some of the expansions seen in Leach’s storm-petrel likely occurred in the common ancestor of the storm-petrels and fulmars, with notable contractions in estimated OR gene number occurring in the latter (Figure 3D). Overall, the signal for OR gene expansion in the lineage leading to the Leach’s storm-petrel is striking, although significant only when DoC-corrected counts are used and when the counts for OR gene numbers in other taxa are assumed to be accurate.
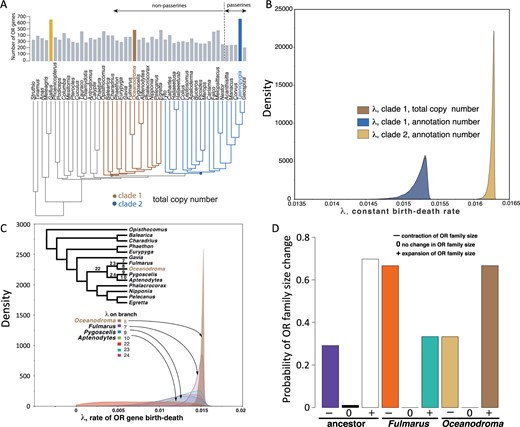
Bayesian analysis of OR gene family evolution across birds. (A) Number of OR genes summarized across birds. Data other than Oceanodroma from Khan et al. (2015). Oceanodroma, chicken (Gallus), and Zebra Finch (Taeniopygia) are highlighted. (B) Posterior distributions of λ, the rate of birth and death, of OR genes under constant rate model for both number of annotated OR genes and estimated number based on depth-of-coverage correction. The posterior distributions of lambda for clade 1 for the annotation and total copy numbers are very similar and broadly overlapping, but one can discern a slightly higher peak for the total copy number curve in brown. (C) Posterior distribution of λ for different branches of clade 1 including Oceanodroma, estimated under the variable rates model and estimated depth-of-coverage-corrected copy number. Under this model and dataset, Oceanodroma has the highest estimated rate. (D) Probabilities of contraction (−), no change (0), or expansion (+) of OR gene number estimated from data from Northern fulmar (Fulmarus), Leach’s storm-petrel (Oceanodroma), and their common ancestor in the tree in (C). These represent the average probability of a specific process, weighted by the number of OR gene categories (intact, pseudogene, or fragment) undergoing that process.
Differential OR gene expression
We compared the patterns of OR gene expression in the olfactory concha, where OR genes are expected to be predominantly expressed, and in the brain, where we expect little OR gene expression (Figure 4 and Supplementary Figure S3). Two OR genes were highly expressed in the olfactory epithelium: OR gene OR6-6 (OR family 6) and OR5-11 (OR family 5). Both OR genes had a copy number ratio of two. OR6-6 and OR5-11 were located on pseudochromosome 1A and 2, respectively, without other intact OR genes close to them (Supplementary Figure S1). We found no differentially expressed OR genes in the olfactory epithelium between male and female adults (Supplementary Figure S4), but identified four OR genes differentially expressed between age classes: OR14-14, OR14-12, OR10-2, and OR14-9 (Figure 4), which are located in different pseudochromosomes (Supplementary Figure S1). The most differentially expressed OR gene, OR14-14, is also the OR gene with the highest copy number ratio at 45 (Supplementary Table S5). OR14-12 and OR14-9 also had a relatively high copy number ratio at 5 and 9, respectively (Supplementary Table S5). The two highly expressed ORs and four differentially expressed ORs are all class II ORs. In contrast to the expression in the olfactory epithelium, most OR genes were not expressed or exhibited minimal (∼0) expression in the brain (Figure 4D), and there were no differentially expressed OR genes among the brain samples. Gene ontology (GO) analyses of 6101 genes significantly differentially expressed (FDR < 0.01) in the olfactory epithelium between age classes revealed categories related to tissue growth and development, such as ossification and collagen fibril organization, as the most significantly enriched (Supplementary Table S6). There were only 28 genes differentially expressed between adult males and females in the olfactory epithelium, with no GO categories enriched.
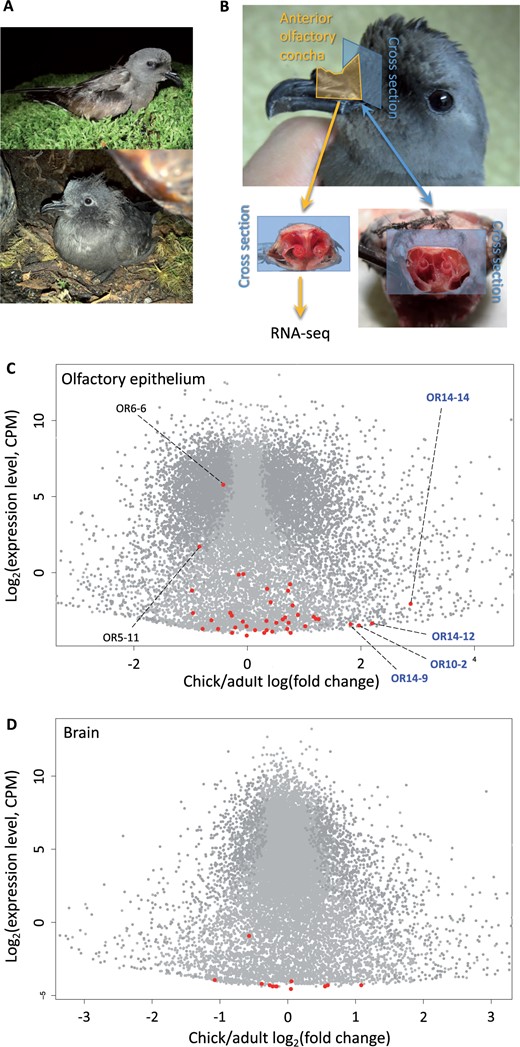
OR genes expression in the olfactory epithelium of anterior olfactory concha of the Leach’s storm-petrel. (A) An adult (upper) and a chick (lower) Leach’s storm-petrel. (B) Anterior olfactory concha of the Leach’s storm-petrel for RNA-seq. (C) Differential expression of the genes in chick vs adult olfactory epithelium. Differentially expressed genes are in dark gray. OR genes are highlighted in red. Four OR genes with higher expression in chicks are labeled with their names in blue. Two most highly expressed OR genes are also labeled. Expression level is in counts per million (CPM). (D) Differential expression of the genes in chick vs adult brain. No OR genes were differentially expressed in the brain. Photo Credit: Simon Sin, Harvard University.
OR genes under positive selection
We found evidence of two recombination breakpoints at nucleotide position 321 and 450 of the OR14 genes, located in the TM3 and TM4 domains, respectively (Figure 5). Based on the inferred breakpoints, we used three data partitions to identify sites under selection in the intact genes of OR family 14, while avoiding the complicating effects of recombination. We identified signals of positive selection in OR family 14 using multiple approaches. Although the overall ω was 0.449 (SLAC), 0.436 (FEL), and 0.449 (MEME), suggesting little evidence for positive selection across the gene as a whole, we detected signals of positive selection in individual codons 4, 107 (in TM3 domain), 156 (in TM4), 200 (in TM5), and 250 (in TM6) using at least two methods (Supplementary Table S7 and Figure 5). We also detected signals of positive selection in codon 218 in TM5 of OR5 genes and codons 16 and 218 in TM5 of OR6 genes using at least two methods (Supplementary Table S7).
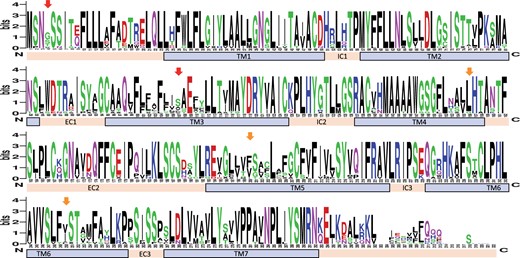
Amino acid sequence variation of the intact family 14 OR genes in the Leach’s storm-petrel. Arrows indicate significant positively selected sites identified by all (red), or at least two methods (orange). Locations of the transmembrane domains (TM1–7), intra-cellular domains (IC1–3), and extra-cellular domains (EC1–3) are shown. The overall height of the stack of symbols indicates the sequence conservation at that codon position. The height of amino acid symbols with the stack indicates the relative frequency of each amino acid at that codon position. Numbers below the stacks indicate codon position.
Discussion
Copy number ratio is a superior estimator of OR gene number
Our high-quality genome of the Leach’s storm-petrel has higher contiguity than many bird genomes produced with short-read technology (Bravo et al. 2021) and allowed us to identify 61 intact OR genes and to estimate the proportion of intact and pseudogenized ORs. Because highly similar sequences from short-read libraries often lead to misassembled genes during whole-genome assembly (Alkan et al. 2011), we examined the copy number ratio of OR sequences using DoC and estimated a more than twofold increase in OR gene number as compared to the annotation-only method. The OR gene number estimate incorporating the copy number ratio should be closer to the actual number of OR genes in this species (Malmstrøm et al. 2016; Sudmant et al. 2010). Contrary to previous suggestions (Khan et al. 2015), we believe that the actual number of OR genes is probably underestimated in most studies using genome blast-based mining and annotation-only methods, a situation similar to the case of highly duplicated MHC genes (Malmstrøm et al. 2016). Mapping of sequencing reads to estimate the copy number ratio is one way to better estimate the actual gene copy number (Malmstrøm et al. 2016).
A limitation of this approach, however, is that the sequencing reads are usually shorter than the assembled OR sequences in the reference genome, and the highly similar nature of OR sequences can hinder mapping assignment. Thus, the mapping DoC for each OR sequence may deviate from the actual copy number ratio and it cannot necessarily be assumed that reads mapping to an intact OR gene themselves originate from an intact duplicate copy (or, conversely, that reads mapping to a pseudogene or gene fragment do not originate from an intact gene copy). It is not unexpected that the read mapping is not completely uniform across the length of each OR gene, and some loci with DoC > 1 do show peaks of DoC, with lower mapping depth in parts of the gene (Supplementary Figure S6). This unevenness could be due to either duplicated gene copies that are truncated or that contain sequence segments that are too divergent from the reference sequence to map well. However, OR14-14, which has the highest estimated copy number in this study, exhibits high DoC across most of the reference sequence (Supplementary Figure S6). This suggests that this OR subfamily does not have many truncated genes, or that gene duplicates are relatively conserved along the entire length, both of which might indicate a recent gene expansion or functional constraint of this lineage. Although genome assemblies built from long-read sequencing data will undoubtedly improve our ability to characterize OR gene repertoires, the total OR copy number estimates obtained here should nevertheless be more accurate than genome mining alone in short-read assemblies.
Validation of our DoC-assisted counting method is strongly corroborated by results obtained from single-copy BUSCO reference genes, where the overwhelming majority of loci (4590/4599, or 99.8%) showed the expected 1X coverage. We also validated the DoC-assisted counting method using the high-quality chicken genome (Ggal6), which has little missing data. The result generally supports the expectation that all ORs in the genome have a copy number estimate of 1, because we found very few loci with copy number greater than 1. However, there are a fair number of loci with copy number of 0, and many of these occur on microchromosomes (Supplementary Tables S10 and S11) that were absent or poorly assembled in previous genome assemblies. These regions that were missing or difficult to assemble prior to long-read sequencing are probably not well-represented in the Illumina short-read data. Our DoC-assisted approach to estimate OR copy number can correct for the effects of OR genes that are collapsed in genomes built from short-read data. However, if the sequencing technology fails to capture portions of the genome that encompass many OR genes, then gene number will still be underestimated. We therefore advocate the use of long-read sequencing technology in the future to provide more accurate estimates of copy number for multigene families such as OR genes (Miller et al. 2017; Driver and Balakrishnan 2021). A recent study comparing short- and long-read-based avian genome assemblies shows that short-read assemblies systematically undercount the avian-specific OR family 14 (Driver and Balakrishnan 2021), whereas the high number of OR gene duplicates can be revealed by long-read assemblies and the DoC method used in this study.
Our results suggest that the number of intact genes in the Leach’s storm-petrel is higher than in other waterbirds when we consider the estimated copy number (Figure 1 and Supplementary Figure S5; Khan et al. 2015). Leach’s storm-petrel also has the highest intact OR number even when estimates of copy number are not considered, and is surpassed by only one waterbird, the little egret (Figure 1). Conversely, the proportion of pseudogenes [pesudogene/(pseudogene+intact gene)] in the Leach’s storm-petrels (approximately 60%) is the lowest reported among waterbirds (69%–87%; Figure 1). Despite being the sister group to the Procellariiformes, the penguins (Sphenisciformes), represented here with Adelie penguin (Pygoscelis adeliae) and emperor penguin (Aptenodytes forsteri), are among the species with the lowest number of intact genes and the highest proportion of pseudogenes. This pattern may reflect their tendency to forage almost exclusively underwater (Lu et al. 2016). Another procellariiform seabird, the Northern fulmar, also has a low number of intact genes and high proportion of pseudogenes similar to penguins. Niimura et al. (2014) showed that the proportion of OR pseudogenes did not correlate with the number of intact OR genes in 13 placental mammals, and suggested that the percentage of OR pseudogenes is a poor indicator of olfactory ability compared to the number of intact genes. By conventional criteria, our Leach’s storm-petrel genome is of higher quality than many avian genomes, yet the annotation counts of OR genes in the Leach’s storm-petrel are not exceptional compared to other birds. However, when we augment these annotation counts with copy number data, estimates of OR gene numbers in Leach’s storm-petrel are significantly higher than in other birds. Inconsistency among studies in the methods used to count OR genes thus challenges our ability to compare species or analyze macroevolutionary patterns.
Macroevolution of OR gene number
Despite these caveats, we tentatively suggest that our analyses of OR gene number across bird species is consistent with a relatively large OR repertoire in the Leach’s storm-petrel compared to other waterbirds. Gene gains and losses through gene duplication, deletion, and pseudogenization are the main processes in OR evolution among birds and other vertebrates (Steiger et al. 2009b; Niimura et al. 2014; Khan et al. 2015; Lu et al. 2016). Our quantification of rates of OR gene birth and death (λBD) using Bayesian analyses will of course be influenced by the method of counting OR genes. If we assume that the copy number-corrected counts of OR genes in Leach’s storm-petrel can be accurately compared to the annotation counts of other bird species, then the variable rates model suggests that rates of OR gene duplication and loss appear to be accelerated in the lineage leading to the Leach’s storm-petrel (Figure 3C). Likewise, the variable rates model showed that overall rates are lower in the clade to which the Leach’s storm-petrel belongs (clade 1; Figure 3B) compared to the clade enriched for passerine birds (clade 2; Figure 3B). When the total OR number is considered, the logarithms of the harmonic means of the likelihoods of the variable model (−441.1053 and −1081.966 for clades 1 and 2, respectively) were lower than that for the constant rate model (−431.2671 and −1042.894, respectively), suggesting strong (clade 1) or very strong (clade 2) support for the variable lambda model in Bayes Factor test (19.68 and 78.14, respectively). As compared to most waterbirds, the larger number of intact OR genes and the smaller percentage of pseudogenized ORs in Leach’s storm-petrels suggests enhanced olfactory capabilities, consistent with the large olfactory bulb to brain ratio in Procellariiformes (Bang 1966; Steiger et al. 2008; Corfield et al. 2015; Khan et al. 2015), and is supported by behavioral tests revealing a well-developed sense of smell in this species (Nevitt and Haberman 2003; O'Dwyer et al. 2008) and other storm-petrels (Nevitt et al. 1995, 2004). We suggest that similar studies in the future (those using short-read sequencing technology) should use the DoC-assisted approach to incorporate OR gene copy number into the estimates.
OR genes and olfactory behaviors of procellariiformes
The use of olfaction for behaviors such as foraging, homing, nest, and potentially mate recognition could be the selective force driving the evolution of OR gene number in this species. In particular, being exclusively pelagic, procellariiforms are uniquely adapted to forage by detecting trace compounds over the open ocean (Nevitt 2000). Previous studies have shown that procellariiform species are attracted to prey-related odorants in a species-specific manner and that behavioral detection thresholds match biological emissions they might naturally encounter while foraging (Nevitt and Bonadonna 2005; Nevitt 2008). For example, DMS is a compound associated with phytoplankton and is now thought to be a keystone odorant in marine foodwebs (Zimmer and Butman 2000). DMS emissions have been experimentally demonstrated to increase when phytoplankton are grazed, and many species of procellariiforms are highly attracted to it as an adaptation for locating zooplankton grazers (Nevitt et al. 1995). Species also use different sensory strategies to forage that are linked to life history, in that burrow nesters track DMS whereas surface nesters do not (Nevitt et al. 1995; van Buskirk and Nevitt 2008). These results predict burrow-nesting procellariiforms such as Leach’s storm-petrels should be particularly well adapted for detecting and discriminating prey-related scented compounds compared to larger surface nesting species, such as the Northern fulmar.
These and other differences in behavior are reflected in the relatively lower OR gene number that has been reported for the Northern fulmar, the only other Procellariiform with its genome sequenced and OR genes studied. For example, Leach’s storm-petrels incubate their eggs and feed their chicks inside an underground burrow, whereas the Northern fulmar nests on the ground (van Buskirk and Nevitt 2008). It has previously been suggested that such differences in early rearing environments are evolutionarily correlated to differences in sensory functions (van Buskirk and Nevitt 2008), with a greater reliance on olfactory foraging for burrow-nesting species, and visually mediated foraging strategies among surface nesters (van Buskirk and Nevitt 2008; Mitkus et al. 2016, 2018). In support of this hypothesis, the Leach’s storm-petrel has recently been shown to have six times lower visual spatial resolution than the Northern fulmar (Mitkus et al. 2016, 2018). However, although the Leach’s storm-petrel has a larger number of OR genes compared to the Northern fulmar, it is premature to draw conclusions about the olfactory capabilities of Northern fulmars, because the quality of its genome assembly is low. Nevertheless, our genomic and transcriptomic evidence is consistent with Leach’s storm-petrel having heightened olfactory capabilities among waterbirds and birds in general. Future studies should focus on the relationship between OR repertoire and species-specific behavioral ecology in a wider and more densely sampled phylogenetic context to understand how natural and sexual selection shapes avian OR evolution.
Highly duplicated and expressed OR genes are under positive selection
Although the phylogenetic analysis did not reveal obvious species-specific expansion of a particular OR gene family in this species (although we cannot rule this out because we do not yet know if the highly duplicated gene copies would have orthologs in other species), several OR genes and domains experienced positive selection. We identified five amino acid sites under positive selection on OR family 14, the family that underwent rapid expansion in birds and showed signals of positive selection in eight other bird species (Khan et al. 2015). Four of the five positively selected sites were located in transmembrane domains 3, 4, 5, and 6. A site in the transmembrane domain 5 of OR families 5 and 6, which comprise highly expressed genes, was also under positive selection. These transmembrane regions were also found to be highly variable in other species, and residues in transmembrane regions 3–7 are predicted and shown to form an odor-binding pocket and to participate in ligand binding (Floriano et al. 2000; Schmiedeberg et al. 2007; Niimura 2012). Specific genes belonging to OR family 14 had a high copy number when we examined the depth of coverage. This family belongs to class II ORs that bind airborne hydrophobic ligands and probably play a crucial role in the olfactory sense of this species, given the high number of copies in the genome.
OR genes experiencing substantial duplications, in particular OR14-14, suggest their high relevance to the ecology of Leach’s storm-petrel. Identification of specific ligands for these ORs will help clarify the driving force for increasing gene copy number. For example, they may be important for foraging if OR14-14 or other OR 14-family genes bind DMS or other ligands used in foraging (Nevitt et al. 1995, 2004), or for communication and recognition if they bind behaviorally relevant odorants produced by other individuals. It is well known that individual olfactory sensory neurons (OSNs) express a single OR allele out of hundreds of loci and alleles in the genome (Monahan and Lomvardas 2015). This monoallelic expression of OR genes determines the olfactory sensitivity of the neuron, determining the ligands that will stimulate it. Under this random monoallelic expression, an OR gene with more copies in the genome should have a larger representation in the OSN population than OR genes with a low copy number. An increase in copy number has been shown to reveal host adaptation, such as the high copy number of amylase genes in humans (Perry et al. 2007). Small sequence differences among OR gene copies may also allow the detection of groups of similar chemicals through neofunctionalization or subfunctionalization (Katju and Bergthorsson 2013). Highly duplicated genes may also facilitate expression variation (Loehlin and Carroll 2016; Geistlinger et al. 2018), although it is unclear what mechanisms are involved since copy number itself is unlikely to change between age classes. Decoding and deorphanizing those highly duplicated ORs is a fascinating area for future research linking the olfactory environment, behavior, and OR evolution.
Differential expression of OR genes between adults and chicks
To confirm that the identified intact OR genes are actually expressed in the olfactory epithelium, we studied the transcriptome of the anterior olfactory concha. The intact OR genes identified transcriptomically were expressed in the olfactory epithelium, and different ORs were expressed at different levels. OR expression was almost absent in the brain sample, which likely included several subportions of the storm-petrel brain, including the olfactory bulb. The pattern of OR expression supports the role of identified OR genes in scent detection via olfaction.
To our knowledge, ours is the first study to investigate OR expression in the olfactory epithelium of birds using a transcriptomic approach (Nef et al. 1996). In other studies, once OR genes are identified by genome mining methods, there is often little or no evidence to confirm the expression of OR genes in the olfactory epithelium. Even in model species such as humans and mice, there are few transcriptomic studies examining OR expression (Ibarra-Soria et al. 2014; Tan et al. 2015; Olender et al. 2016). Interpreting OR gene evolution and understanding the relevance of ORs to sensory behavior may be hampered by the mistaken assumption that all annotated OR genes play a role in the sense of smell. By determining the expression of OR genes in different body tissues, we will be able to refine the functional interpretation of different OR genes, which may have roles outside of olfaction (Spehr et al. 2003; Pluznick et al. 2009). The differences in OR expression level among OR genes could be due to spatial patterning of OSN types in the olfactory epithelium (Coleman et al. 2019). Now that we have identified OR genes and transcripts in this study, future investigations can focus on the spatial and temporal patterns of OR gene expression, which is currently lacking in birds (Nef et al. 1996), and has only been studied in a few model species such as mice (Hanchate et al. 2015; Coleman et al. 2019).
We found four OR genes that were differentially expressed in the olfactory epithelium between adults and chicks, belonging to families 14 and 10, both of which are class II ORs. All four genes were more highly expressed in chicks. Leach’s storm-petrel chicks can readily perform odor discrimination tasks soon after hatching (O'Dwyer et al. 2008). A recent study by Mitkus et al. (2018) has shown that Leach’s storm-petrel chicks are blind for the first 2–3 weeks post hatching, suggesting a heightened reliance on olfaction. In our study, some of the most over-expressed genes we identified in chick compared to adult olfactory conchae are involved in ossification and soft tissue development (Supplementary Table S6), such as the genes SPARC, PHOSPHO1, Smpd3, COL1A1, COL1A2, and COL11A1. The olfactory epithelium was probably developing rapidly during the time chicks were sampled, perhaps resulting in higher expression levels of some OR genes in chicks than in adults, such as OR14-14. The increased expression level of highly duplicated OR genes in chicks is consistent with the importance of rapid development of those ORs to detect scented compounds that may impact chick survival or survival and fitness later in life. Alternatively, the lifespan of OSNs is affected by how frequently the ORs are used (Santoro and Dulac 2012). There is a mechanism to reduce the lifespan of OSNs that express infrequently used ORs (Santoro and Dulac 2012). This process can modulate the OSN population dynamics to adapt the olfactory system to a particular environment by changing the relative number of different types of OSNs, and the relative abundance of different OSNs changes with age and experience (Nevitt et al. 1994; Santoro and Dulac 2012; van der Linden et al. 2018). We have noted that adult storm-petrels live highly pelagic lives foraging by scent over the open ocean. It is also well-established that burrow-nesting procellariiforms use olfactory cues to locate nesting burrows (e.g., Grubb 1974; Bonadonna and Bretagnolle 2002; Bonadonna et al. 2004) and recognize their mates (Bonadonna and Nevitt 2004). Thus, it seems reasonable to predict that adults would express a different repertoire of ORs than a developing chick, which spends its early life being provisioned by parents inside a dark, underground burrow, despite the fact that Leach’s storm-petrel chicks are also very capable of discriminating nest-specific and personal odors in choice tests (O'Dwyer et al. 2008). The difference in OR expression between chicks and adults might be caused by the difference in the usage frequency of different type of ORs, leading to variation in the lifespan and abundance of each type of OSN.
It has been proposed that MHC genes can affect body odor by changing the peptide community in the body (Restrepo et al. 2006). Moreover, individuals with different MHC genotypes may harbor a different microbiome, which in turn produces different secondary metabolites and odor (Pearce et al. 2017). Highly diverse bacterial communities are often found in animal scent glands (e.g., Sin et al. 2012), and the uropygial gland of birds is one potential place that the secretion odor is affected by the microbiome it harbors (Whittaker et al. 2016). In Leach’s storm-petrels, males appear to select their mates based on the MHC genotypes, but females do not (Hoover et al. 2018). Some insects using odors to select mates exhibit sexual dimorphism in the olfactory system. The sex difference in MHC-based mate choice behavior in this species might be mediated through differentiated olfactory response to candidate mates with different body odors, which in turn could be due to intersexual differences in olfactory capabilities. Our study of gene expression in the olfactory epithelium revealed no intersexual differences in OR expression in adults. Thus, our study does not support the idea that intersexual differences in MHC-based mate choice behavior were due to different OR gene usages. However, this does not rule out that sexual dimorphism occurs more centrally in the brain.
Conclusions
This study advances our knowledge of avian OR gene evolution. Our results demonstrate that a procellariiform seabird with well-developed olfactory capabilities has the largest number of intact OR genes and the lowest proportion of pseudogenes among waterbirds surveyed thus far. Using a novel copy number-assisted counting method, we also show that the genome mining method employed by many OR gene studies underestimates OR gene number. Our genomic evidence is consistent with storm-petrel’s well-developed olfactory capabilities, which is linked to its pelagic lifestyle and behavioral ecology. In addition, this is the first study to use transcriptomics to determine the expression pattern of OR genes in avian olfactory epithelium. ORs are also expressed in non-olfactory tissues, but most studies do not test if the OR genes identified by genome mining are expressed in the olfactory epithelium or not. Here we identified OR genes that are highly expressed, as well as OR genes differentially expressed between age groups. The results improve our knowledge of the development of olfactory capabilities in this and other avian species. We anticipate that our copy number-assisted method and transcriptomic approach will accelerate comparative studies of OR gene evolution in birds and other vertebrates in future studies.
Data availability
The draft genome and transcriptomic data are available via NCBI (BioProject number: PRJNA776570). The gene alignments and sequence information are in Supplementary materials (S12 and S13). The scripts for bioinformatics analyses are in Supplementary Appendix S1.
Supplementary material is available at GENETICS online.
Acknowledgments
The authors thank Lee Adams and David Shutler for logistical support, Marcel Losekoot for data management, Brian Hoover and Logan Lewis-Mummert for field assistance at UC Davis, Prof. Shelley Adamo and Laura Hall at Dalhousie University and the Bauer Core Facility at Harvard University (especially Jennifer Couget, Christian Daly and Claire Reardon) for laboratory assistance. The authors thank Tim Sackton for his help with the genome assembly and Liang Liu for assistance with the Bayesian model. The computations in this paper were performed on the Odyssey cluster at Harvard University and supported by Harvard University Research Computing. S.Y.W.S., G.N., and S.V.E. designed research; S.Y.W.S. performed research; S.Y.W.S., A.C., and S.V.E. analyzed data; S.Y.W.S. wrote the paper and all authors contributed to revised versions.
Funding
This research was supported by the National Science Foundation (award numbers: NSF Grant IOS-1258784, NSF IOS 0922640/IBN 0212467, and IOS 1258828).
Ethics approval
All sampling was conducted in adherence to guidelines defined by the University of California, Davis Institutional Animal Care and Use Committee (IACUC) protocol # 19288, Harvard University IACUC protocol # 24-06-2, and Canadian Wildlife Service (permit # SC2792).
Conflicts of interest
The authors declare that there is no conflict of interest.
Literature cited
Author notes
These authors contributed equally to this work.
