


Abstract
Bioinformatic analysis—such as genome assembly quality assessment, alignment summary statistics, relative synonymous codon usage, file format conversion, and processing and analysis—is integrated into diverse disciplines in the biological sciences. Several command-line pieces of software have been developed to conduct some of these individual analyses, but unified toolkits that conduct all these analyses are lacking. To address this gap, we introduce BioKIT, a versatile command line toolkit that has, upon publication, 42 functions, several of which were community-sourced, that conduct routine and novel processing and analysis of genome assemblies, multiple sequence alignments, coding sequences, sequencing data, and more. To demonstrate the utility of BioKIT, we conducted a comprehensive examination of relative synonymous codon usage across 171 fungal genomes that use alternative genetic codes, showed that the novel metric of gene-wise relative synonymous codon usage can accurately estimate gene-wise codon optimization, evaluated the quality and characteristics of 901 eukaryotic genome assemblies, and calculated alignment summary statistics for 10 phylogenomic data matrices. BioKIT will be helpful in facilitating and streamlining sequence analysis workflows. BioKIT is freely available under the MIT license from GitHub (https://github.com/JLSteenwyk/BioKIT), PyPi (https://pypi.org/project/jlsteenwyk-biokit/), and the Anaconda Cloud (https://anaconda.org/jlsteenwyk/jlsteenwyk-biokit). Documentation, user tutorials, and instructions for requesting new features are available online (https://jlsteenwyk.com/BioKIT).
Introduction
Bioinformatics is the application of computational tools to process and analyze biological data, such as nucleotide or amino acid sequences in the form of genome assemblies, gene annotations, and multiple sequence alignments (Bayat 2002). Diverse disciplines in the biological sciences rely on bioinformatic methods and software (Wren 2016). Researchers have acknowledged the need to consider diverse types of biological scientists with different levels of experience, including those with no experience—such as students in classroom settings, when developing software (Kumar and Dudley 2007). It is also essential to implement high standards of software development that ensure software functionality and archival stability (Mangul, Martin, et al. 2019; Mangul, Mosqueiro, et al. 2019). For example, code quality can be improved by utilizing tests that help ensure faithful function of code and facilitate debugging (Darriba et al. 2018). More specifically, integration tests examine end-to-end functionality of software, whereas unit tests evaluate the functionality of smaller chunks of code. Both tests ensure specific inputs result in expected outputs. As a result, the development of effective and user-friendly software for diverse biologists often requires an interdisciplinary team of software engineers, biologists, and others.
Even though numerous bioinformatic pieces of software are available, there are still several barriers to creating seamless and reproducible workflows (Kim et al. 2018). This issue in part stems from different pieces of software requiring different input file formats, being unable to account for nonstandard biological phenomena, such as the use of alternative genetic codes, or can only be executed using web servers or graphical user interfaces, which cannot be incorporated into high-throughput pipelines. Another factor is that multiple pieces of software or custom scripts are typically needed to execute different steps in a larger bioinformatic pipeline; for example, bioinformatic workflows often rely on 1 software/script for converting file formats, another software/script for translating sequences using standard and nonstandard genetic codes, another software/script to examine the properties of genomes or multiple sequence alignments, etc. As a result, maintaining efficacious bioinformatic workflows is cumbersome (Kulkarni et al. 2018). To address this need, package, and workflow managers have facilitated stringing together numerous pieces of software. An alternative approach to addressing this issue is the development of multipurpose toolkits that contain diverse processing and analysis functions and therefore reduce the overall number of pieces of software users need to install regardless of the use of package and workflow managers.
To address this need, we—an interdisciplinary team of software engineers, evolutionary biologists, molecular biologists, microbiologists, and others—developed BioKIT, a versatile toolkit that currently has 42 functions, several of which were requested by the research community, that conduct routine and novel processing and analysis of diverse sequence files including genome assemblies, multiple sequence alignments, protein coding sequences, and sequencing data (Table 1). Functions implemented in BioKIT facilitate a wide variety of standard bioinformatic analyses, including processing and analysis of protein coding sequences (e.g. translation using 26 genetic codes including user-specified translation tables, GC content at the first, second, and third codon positions, and relative synonymous codon usage), evaluation of genome assembly quality [e.g. N50, L50, assembly size, guanine–cytosine (GC) content, number of scaffolds, and others], and the calculation of multiple sequence alignment properties (i.e. number of taxa, alignment length, the number of constant sites, the number of parsimony-informative sites, and the number of variable sites). To demonstrate the utility of BioKIT, we calculated relative synonymous codon usage in 171 fungal genomes, estimated codon optimization in each gene from 2 Saccharomyces budding yeast species using a novel metric, gene-wise relative synonymous codon usage (gRSCU), examined the genome assembly quality of 901 eukaryotic genomes, and evaluated the properties of 10 phylogenomic data matrices. We hope that BioKIT will improve reproducibility and accessibility of diverse bioinformatic analysis, serve as an effective teaching tool, and facilitate discovery in the biological sciences.
Summary of 42 functions available in BioKIT at the time of publication.
| Function name | Description | Type of function | Input data | Citation | Example software that performs this function |
|---|---|---|---|---|---|
| alignment_length | Calculate alignment length | Analysis | Multiple-sequence file in FASTA format | NA | AMAS (Borowiec 2016) |
| alignment_recoding | Recode alignments using reduced character states | Processing | Multiple-sequence file in FASTA format | Woese et al. (1991), Embley et al. (2003), Kosiol et al. (2004), Hrdy et al. (2004), Susko and Roger (2007) | Custom scripts (Hernandez and Ryan 2021) |
| alignment_summary | Summarize diverse properties of a multiple sequence alignment | Analysis | Multiple-sequence file in FASTA format | NA | AMAS (Borowiec 2016); custom scripts (Shen, Salichos, et al. 2016); PhyKIT (Steenwyk, Buida, et al. 2021) |
| consensus_sequence | Generates a consensus sequence | Analysis | Multiple-sequence file in FASTA format | Sternke et al. (2019) | Geneious (https://www.geneious.com) |
| constant_sites | Determine the number of constant sites in an alignment | Analysis | Multiple-sequence file in FASTA format | Kumar et al. (2016) | IQ-TREE (Minh et al. 2020) |
| parsimony_ informative_sites | Determine the number of parsimony-informative sites in an alignment | Analysis | Multiple-sequence file in FASTA format | Kumar et al. (2016) | AMAS (Borowiec 2016); custom scripts (Shen, Salichos, et al. 2016) |
| position_specific_ score_matrix | Generates a position specific score matrix for an alignment | Analysis | Multiple-sequence file in FASTA format | Gribskov et al. (1987) | BLAST+ (Camacho et al. 2009) |
| variable_sites | Determine the number of variable sites in an alignment | Analysis | Multiple-sequence file in FASTA format | Shen, Salichos, et al. (2016) | AMAS (Borowiec 2016); custom scripts (Shen, Salichos, et al. 2016); PhyKIT (Steenwyk, Buida, et al. 2021) |
| gc_content_first_ position | Determine the GC content of the first codon position among protein coding sequences | Analysis | Protein coding sequences in FASTA format | Bentele et al. (2013) | Custom scripts (Bentele et al. 2013) |
| gc_content_second_ position | Determine the GC content of the second codon position among protein coding sequences | Analysis | Protein coding sequences in FASTA format | Bentele et al. (2013) | Custom scripts (Bentele et al. 2013) |
| gc_content_third_ position | Determine the GC content of the third codon position among protein coding sequences | Analysis | Protein coding sequences in FASTA format | Bentele et al. (2013) | Custom scripts (Bentele et al. 2013) |
| gene_wise_relative_ synonymous_ codon_usage | Calculate gene-wise relative synonymous codon usage | Analysis | Protein coding sequences in FASTA format | This study | This study |
| relative_synonymous_ codon_usage | Calculate relative synonymous codon usage | Analysis | Protein coding sequences in FASTA format | Xu et al. (2008) | MEGA (Kumar et al. 2016) |
| translate_sequence | Translate protein coding sequences to amino acid sequences | Processing | Protein coding sequences in FASTA format | NA | EMBOSS (Rice et al. 2000) |
| fastq_read_lengths | Examine the distribution of read lengths | Analysis | Sequence reads in FASTQ format | NA | FQStat (Chanumolu et al. 2019) |
| subset_pe_fastq_reads | Down sample paired-end reads | Processing | Sequence reads in FASTQ format | NA | SeqKit (Shen, Le, et al. 2016) |
| subset_se_fastq_reads | Down sample single-end reads | Processing | Sequence reads in FASTQ format | NA | SeqKit (Shen, Le, et al. 2016) |
| trim_pe_fastq_reads | Trim paired-end reads based on quality and length thresholds | Analysis | Sequence reads in FASTQ format | NA | Trimmomatic (Bolger et al. 2014) |
| trim_se_fastq_reads | Trim single-end reads based on quality and length thresholds | Analysis | Sequence reads in FASTQ format | NA | Trimmomatic (Bolger et al. 2014) |
| trim_pe_adapters_fastq_reads | Trim adapters from paired-end reads and implement length thresholds | Analysis | Sequence reads in FASTQ format | NA | Trimmomatic (Bolger et al. 2014) |
| trim_se_ adapters_fastq_reads | Trim adapters from single-end reads and implement length thresholds | Analysis | Sequence reads in FASTQ format | NA | Trimmomatic (Bolger et al. 2014) |
| gc_content | Determine GC content | Analysis | FASTA file of nucleotide sequences | Romiguier et al. (2010) | custom scripts (Shen, Salichos, et al. 2016); GC-Profile (Gao and Zhang 2006) |
| genome_assembly_metrics | Determine diverse properties of a genome assembly for quality assessment and characterization | Analysis | FASTA file of a genome assembly | Gurevich et al. (2013) | QUAST (Gurevich et al. 2013); REAPR (Hunt et al. 2013) |
| l50 | L50 | Analysis | FASTA file of a genome assembly | Gurevich et al. (2013) | QUAST (Gurevich et al. 2013) |
| l90 | L90 | Analysis | FASTA file of a genome assembly | Gurevich et al. (2013) | QUAST (Gurevich et al. 2013) |
| longest_scaffold | Determine the length of the longest entry in a FASTA file | Analysis | FASTA file | Gurevich et al. (2013) | Custom scripts (Ou et al. 2020) |
| n50 | N50 | Analysis | FASTA file of a genome assembly | Gurevich et al. (2013) | QUAST (Gurevich et al. 2013) |
| n90 | N90 | Analysis | FASTA file of a genome assembly | Gurevich et al. (2013) | QUAST (Gurevich et al. 2013) |
| number_of_large_scaffolds | Determine the number and length of scaffolds longer than 500 nucleotides. Length threshold of 500 nucleotides can be modified by the user | Analysis | FASTA file | NA | QUAST (Gurevich et al. 2013) |
| number_of_scaffolds | Determine the number of FASTA entries | Analysis | FASTA file | NA | QUAST (Gurevich et al. 2013) |
| sum_of_scaffold_lengths | Determine the total length of all FASTA entries | Analysis | FASTA file | NA | QUAST (Gurevich et al. 2013) |
| character_frequency | Determine the frequency of each character. Gaps are assumed to be represented as ‘?’ and ‘-’ characters | Analysis | FASTA file | NA | Biostrings (https://rdrr.io/bioc/Biostrings/) |
| faidx | Get sequence entry from FASTA file | Processing | FASTA file | NA | SAMtools (Li et al. 2009) |
| file_format_converter | Converts multiple sequence alignments from one format to another | Processing | FASTA, Clustal, MAF, Mauve, Phylip, Phylip-sequential, Phylip-relaxed, and Stockholm | NA | ALTER (Glez-Pena et al. 2010) |
| multiple_line_to_single_line_fasta | Reformat sequences to be represented on one line | Processing | FASTA file | NA | FASTX-Toolkit (http://hannonlab.cshl.edu/fastx_toolkit/) |
| remove_fasta_entry | Remove sequence based on entry identifier | Processing | FASTA file | NA | NA |
| remove_short_sequences | Remove short sequences | Processing | FASTA file | NA | NA |
| rename_fasta_entries | Rename FASTA entries | Processing | FASTA file | NA | FASTX-Toolkit (http://hannonlab.cshl.edu/fastx_toolkit/) |
| reorder_by_sequence_length | Reorder FASTA entries by length | Processing | FASTA file | NA | SeqKit (Shen, Le, et al. 2016) |
| sequence_complement | Generate sequence complements in the forward or reverse direction | Processing | FASTA file | Britten (1998) | EMBOSS (Rice et al. 2000) |
| sequence_length | Calculate the length of each FASTA file | Analysis | FASTA file | NA | bioawk (https://github.com/lh3/bioawk) |
| single_line_to_multiple_line_fasta | Reformat sequences to be represented on multiple lines | Processing | FASTA file | NA | FASTX-Toolkit (http://hannonlab.cshl.edu/fastx_toolkit/) |
Materials and methods
BioKIT is an easy-to-install command-line software that conducts diverse bioinformatic analyses. BioKIT is written in the Python programming language and has few dependencies, namely Biopython (Cock et al. 2009) and NumPy (Van Der Walt et al. 2011).
BioKIT currently has 42 functions that process and analyze sequence files such as genome assemblies, multiple-sequence alignments, protein coding sequences, and sequencing data (Table 1). Processing functions include those that convert various file formats, subset sequence reads from FASTQ files, rename entries in FASTA files, and others. Analysis functions include those that trim sequence reads in FASTQ files according to quality and length thresholds, calculate relative synonymous codon usage, estimate codon optimization, and others. Where applicable, BioKIT functions can also take standard output as input thereby enabling the use of POSIX pipes.
Details about each function, their usage, tutorials, and other information such as how to request additional functions can be found in the online documentation (https://jlsteenwyk.com/BioKIT). To demonstrate the utility of BioKIT, we highlight 4 use-cases: (1) determination of relative synonymous codon usage using different genetic codes; (2) determination of a novel metric for estimation of gene-wise codon optimization, gene-wise relative synonymous codon usage (gRSCU); (3) genome assembly quality assessment; and (4) summarizing properties of multiple sequence alignments.
Examining features of coding sequences including relative synonymous codon usage
BioKIT contains multiple functions that process or analyze protein coding sequences including translating protein coding sequences into amino acids. One distinct advantage of BioKIT is its ability to account for diverse genetic codes (currently, BioKIT comes complete with 26 genetic codes) or take as input a user-defined translation table. Other coding sequence-related analyses include determining the GC content at the first, second, and third codon positions.
Here, we highlight the relative_synonymous_codon_usage function, which calculates relative synonymous codon usage, the ratio of the observed frequency of synonymous codons to an expected frequency in which all synonymous codons are used equally (Xu et al. 2008). In this analysis, overrepresented codons have relative synonymous codon usage values greater than one whereas underrepresented codons have relative synonymous codon usage values less than 1. Relative synonymous codon usage values of one fit the neutral expectation. The relative_synonymous_codon_usage function can be used with one of 26 genetic codes including user-specified translation tables. The ability of BioKIT to account for diverse genetic codes, which cannot be done by other currently available software, makes it uniquely suitable for analyses of lineages that contain multiple genetic codes (Krassowski et al. 2018; LaBella et al. 2019). Other software that conduct similar analyses include DAMBE and GCUA (McInerney 1998; Xia 2013).
Genome assembly quality assessment
Determination of genome assembly properties is essential when evaluating assembly quality (Gurevich et al. 2013; Hunt et al. 2013). To facilitate these analyses, the genome_assembly_metrics function in BioKIT calculates 14 diverse properties of genome assemblies that evaluate assembly quality and characteristics including:
assembly size: sum length of all contigs/scaffolds;
L50 (and L90): the number of contigs/scaffolds that make up 50% (or, in the case of L90, 90%) of the total length of the genome assembly;
N50 (and N90): the length of the contig/scaffold which, along with all contigs/scaffolds longer than or equal to that contig/scaffold, contain 50% (or, in the case of N90, 90%) the length of a particular genome assembly;
GC content: fraction of total bases that are either G or C;
number of scaffolds: total number of contigs/scaffolds;
number and sum length of large scaffolds: total number and sum length of contigs/scaffolds above 500 nucleotides in length (length threshold of a “large scaffold” can be modified by the user); and
frequency of nucleotides: fraction of occurrences for adenine (A), thymine, (T), G, and C nucleotides.
Each metric can also be called using individual functions (e.g. the n50 function calculates the N50 of an assembly and the number_of_large_scaffolds function calculates the number of large scaffolds in an assembly). We anticipate the ability of BioKIT to summarize genome assembly properties will be helpful for assessing genome quality as well as in comparative studies of genome properties, such as the evolution of genome size and GC content (Walker et al. 2015; Shen et al. 2020). Other pieces of software that conduct similar analyses include QUAST, REAPR, and GenomeQC (Gurevich et al. 2013; Hunt et al. 2013; Manchanda et al. 2020).
Processing and assessing the properties of multiple sequence alignments
Multiple sequence alignments—the alignment of 3 or more biological sequences—contain a wealth of information. To facilitate easy use and manipulation of multiple sequence alignments, BioKIT implements 16 functions that process or analyze alignments including: generating consensus sequences; generating a position-specific score matrix (which represents the frequency of observing a particular amino acid or nucleotide at a specific position); recoding an alignment using different schemes, such as the RY-nucleotide scheme for nucleotide alignments (Woese et al. 1991; Phillips et al. 2001) or the Dayhoff-6, S&R-6, and KGB-6 schemes for amino acid alignments (Embley et al. 2003; Hrdy et al. 2004; Kosiol et al. 2004; Susko and Roger 2007); converting alignments among the following formats: FASTA, Clustal, MAF, Mauve, PHYLIP, PHYLIP-sequential, PHYLIP-relaxed, and Stockholm; extracting entries in FASTA files; removing entries from FASTA file; removing short sequences from a FASTA file; and others.
We highlight the alignment_summary function, which calculates numerous summary statistics for a multiple sequence alignment, a common step in many molecular evolutionary analyses (Plomion et al. 2018; Winterton et al. 2018). More specifically, the alignment_summary function calculates:
alignment length: the total number of sites in an alignment;
number of taxa: the total number of sequences in an alignment;
number of parsimony-informative sites: a site in an alignment with at least 2 distinct nucleotides or amino acids that each occur at least twice;
number of variable sites: a site in an alignment with at least 2 distinct nucleotides or amino acids;
number of constant sites: sites with the same nucleotide or amino acid (excluding gaps); and
the frequency of all character states: the fraction of occurrence for all nucleotides or amino acids (including gap characters represented as “–” or “?” in an alignment).
Like the genome_assembly_metrics function, each metric can be calculated individually (e.g. the constant_sites function calculates the number of constant sites in an alignment and the character_frequency function calculates the frequency of all character states). We anticipate the alignment_summary function will assist researchers in statistically evaluating the properties of their alignments, which may help guide subsampling strategies in phylogenomic studies (Edwards 2016; Mongiardino Koch 2021). Other pieces of software that perform similar operations include AMAS (Borowiec 2016) and Mesquite (Mesquite Project Team 2014). One advantage of BioKIT compared with other software [such as Phyutility (Smith and Dunn 2008)] the ability to calculate diverse summary statistics.
Implementing high standards of software development
Archival instability is a concern for bioinformatic tools and threatens the reproducibility of bioinformatic research. For example, in an analysis that aimed to evaluate the “installability” of bioinformatic software, 28% of over 36,000 bioinformatic tools failed to properly install due to implementation errors (Mangul, Mosqueiro, et al. 2019). To ensure archival stability of BioKIT, we implemented a previously established protocol (Steenwyk et al. 2020; Steenwyk, Buida, et al. 2021; Steenwyk, Goltz, et al. 2021; Steenwyk and Rokas 2021b) for high standards of software development and design practices. More specifically, we wrote 339 unit and integration tests that ensure faithful functionality of BioKIT and span 95.35% of the codebase. We also implemented a continuous integration pipeline, which builds, packages, installs, and tests the functionality of BioKIT across Python versions 3.6, 3.7, 3.8, and 3.9. To accommodate diverse installation workflows, we also made BioKIT freely available under the MIT license across popular platforms including GitHub (https://github.com/JLSteenwyk/BioKIT), PyPi (https://pypi.org/project/jlsteenwyk-biokit/), and the Anaconda Cloud (https://anaconda.org/jlsteenwyk/jlsteenwyk-biokit). To make BioKIT more user-friendly, we wrote online documentation, user tutorials, and instructions for requesting new features (https://jlsteenwyk.com/BioKIT). We anticipate our strategy to implement high standards of software development, coupled to our approach to decrease barriers to software usage (e.g. easy installation and extensive documentation), will address instabilities observed among many bioinformatic software and increase the long-term usability of BioKIT.
Results
Relative synonymous codon usage in 107 budding yeast and filamentous fungi
To demonstrate the utility of BioKIT in analyzing protein coding sequences, we calculated the relative synonymous codon usage of all codons in the protein coding sequences of 103 Eurotiomycetes (filamentous fungi) and 68 Saccharomycetes (budding yeasts) genomes obtained from the RefSeq database of NCBI (Fig. 1). This example also demonstrates the flexibility of BioKIT to account for nonstandard genetic codes, which are observed among some budding yeasts that use the CUG codon to encode a serine or alanine rather than a leucine (Krassowski et al. 2018). Hierarchical clustering of relative synonymous codon usage values per codon (columns in Fig. 1) revealed similar patterns across groups of codons. For example, CUA, AUA, and GUA—3 of the 4 codons that end in UA—were underrepresented in all fungi. Hierarchical clustering of relative synonymous codon usage values per species (rows in Fig. 1) revealed filamentous fungi and budding yeasts often clustered separately. For example, UGA, GUG, AAC, UAC, AAG, UUC, UCC, ACC, GCC, CGC, CUG, AUC, GUC, CUC, and GGC are more often overrepresented among filamentous fungi in comparison to budding yeasts; in contrast, UUG, GUU, CCA, and GGU are more often overrepresented among budding yeasts in comparison to filamentous fungi. Variation within each lineage was also observed; for example, UUA was underrepresented in most, but not all, budding yeasts. These findings demonstrate how BioKIT can be used to examine patterns of RSCU in a single genome or across species.
Relative synonymous codon usage across 171 fungal genomes. Relative synonymous codon usage (RSCU) was calculated from the coding sequences of 103 Eurotiomycetes (filamentous fungi) and 68 Saccharomycetes (budding yeasts) genomes obtained from NCBI. Hierarchical clustering was conducted across the fungal species (rows) and codons (columns). Eight groups of clustered rows were identified; 7 groups of clustered columns were identified. Broad differences were observed in the RSCU values of Eurotiomycetes and Saccharomycetes genomes. For example, Saccharomycetes tended to have higher RSCU values for the AGA codon, whereas Eurotiomycetes tended to have higher RSCU values for the CUG codon. To account for the use of an alternative genetic code in budding yeast genomes from the CUG-Ser1 and CUG-Ser2 lineages (Krassowski et al. 2018), the alternative yeast nuclear code—which is one of 26 alternative genetic codes incorporated into BioKIT—was used during RSCU determination. User’s may also provide their own genetic code if it is unavailable in BioKIT. This figure was made using pheatmap (Kolde 2012).
Patterns of gene-wise codon usage bias can be used to assess codon optimization and predict steady-state gene expression levels
To evaluate the utility of BioKIT in examining gene-wise codon usage biases, we calculated the mean and median gRSCU value, a novel metric introduced in the present manuscript, for individual protein coding genes in the genome of the baker’s yeast Saccharomyces cerevisiae (Fig. 2a). Mean and median gRSCU values were often, but not always, similar—the average absolute difference between mean and median gRSCU is 0.05 ± 0.04. In S. cerevisiae, as well as other organisms, genes encoding ribosomal components and histones are known to be codon optimized and highly expressed (Sharp et al. 1986; Hershberg and Petrov 2009; LaBella et al. 2021). Therefore, we hypothesized that genes with high gRSCU values will have functions related to ribosomes or histones because patterns of gene-wise codon usage bias may be indicative of codon optimization. Supporting this hypothesis, examination of the 10 genes with the highest mean gRSCU revealed 5 genes with ribosome-related functions [RPL41B (YDL133C-A), mean gRSCU: 1.60; RPL41A (YDL184C), mean gRSCU: 1.58; RPS14A (YCR031C), mean gRSCU: 1.44; RPS9B (YBR189W), mean gRSCU: 1.43; and RPL18A (YOL120C), mean gRSCU: 1.43] and 4 genes with histone-related functions [HHF1 (YBR009C), mean gRSCU: 1.45; HTA2 (YBL003C), mean gRSCU: 1.44; HHF2 (YNL030W), mean gRSCU: 1.43; and HTA1 (YDR225W), mean gRSCU: 1.43]. Examination of the 10 most optimized genes according to median gRSCU revealed similar observations wherein 9 genes had ribosome-related functions [RPS14A (YCR031C), median gRSCU: 1.48; RPS12 (YOR369C), median gRSCU: 1.40; RPS30B (YOR182C), median gRSCU: 1.40; RPP2A (YOL039W), median gRSCU: 1.40; RPL18A (YOL120C), median gRSCU; RPS3 (YNL178W), median gRSCU: 1.40; RPL13B (YMR142C), median gRSCU: 1.40; RPP0 (YLR340W), median gRSCU: 1.40; and RPS0B (YLR048W), median gRSCU: 1.40]. More broadly, genes associated with the 60S and 40S ribosomal units (gold color in Fig. 2a) tended to have high gRSCU values. These results suggest gRSCU values may be useful for estimating codon optimization.
Mean gene-wise relative synonymous codon usage accurately estimates codon optimization. a) Gene-wise relative synonymous codon usage (gRSCU), the mean (x-axis) or median (y-axis) relative synonymous codon usage value per gene (based on RSCU values calculated from the entire set of protein coding genes), was calculated from the coding sequences of the model budding yeast Saccharomyces cerevisiae. b, c) In S. cerevisiae, a significant correlation was observed between tRNA adaptation index (tAI), a well-known measure of codon optimization (Sabi and Tuller 2014), and mean as well as median gRSCU (r2 = 0.52, P < 0.001 and r2 = 0.25, P < 0.001, respectively; Pearson's Correlation Coefficient). d) Using previously published data, a correlation is observed between median log2 gene expression and tAI in Saccharomyces mikatae (LaBella et al. 2019), which is evidence of tAI values being indicative of codon optimization. Comparison of mean and median gRSCU (e and f, respectively) and median log2 gene expression revealed similarly strong correlations (r2 = 0.57, P < 0.001 and r2 = 0.41, P < 0.001, respectively; Pearson’s correlation coefficient). Of note, mean gRSCU had a strong correlation to gene expression than median gRSCU. Each gene is represented by a dot. In (a), the size of each dot represents the standard deviation of RSCU values observed in the gene.
To further explore the relationship between gRSCU and codon optimization, we compared gRSCU values to the values of the tRNA adaptation index, a measure of codon optimization (Sabi and Tuller 2014), in S. cerevisiae as well as in steady state gene expression data from Saccharomyces mikatae (LaBella et al. 2019). In S. cerevisiae, strong correlation was observed between mean gRSCU and tRNA adaptation index values (Fig. 2b) and a less robust, but still significant, correlation was observed between median gRSCU and tRNA adaptation index values (Fig. 2c). Examination of gRSCU and gene expression data from S. mikatae revealed a robust correlation (Fig. 2, e and f) suggesting gRSCU, and in particular the mean gRSCU, can serve as a measure of gene-wise codon optimization.
Genome assembly quality and characteristics among 901 eukaryotic genomes
Other functions in BioKIT can facilitate, but are not limited to, examining data quality, a prerequisite for many downstream analyses. For example, BioKIT can be useful in examining genome assembly quality and characteristics. To do so, we calculated 14 diverse genome assembly metrics among 901 scaffold-level haploid assemblies of eukaryotic genomes, which were obtained from NCBI, and span 3 major classes of animals (Mammalia; N = 350), plants (Magnoliopsida; N = 336), and fungi (Eurotiomycetes; N = 215). Genome assembly properties exhibited variation both within and between the 3 classes (Fig. 3). For example, fungi had the smallest average genome size of 32.71 ± 7.04 Megabases (Mb) whereas mammals had the largest average genome size of 2,645.50 ± 487.48 Mb. Extensive variation in genome size within each class corroborates previous findings of extreme genome size variation among eukaryotes (Elliott and Gregory 2015). Variation in GC content, a genome property that has been actively investigated for decades (Galtier et al. 2001; Romiguier et al. 2010; Serres-Giardi et al. 2012), was observed among the 3 eukaryotic classes—animals, plants, and fungi had an average GC content of 0.40 ± 0.04, 0.35 ± 0.04, and 0.49 ± 0.03, respectively. Lastly, there was wide variation in genome assembly metrics associated with continuity of assembly. For example, the average N50 values for animals, plants, and fungi were 12,287.64 ± 25,317.31 Mb, 5,030.15 ± 19,358.58 Mb, and 1,370.77 ± 1,552.13 Mb, respectively. Taken together, these results demonstrate BioKIT can assist researchers in examining genome assembly quality but can also be used for studying genome evolution—such as the evolution of genome size and GC content.
![Summary of genome assembly metrics across 901 genomes from 3 eukaryotic classes. Nine hundred and one scaffold-level genome assemblies from 3 major eukaryotic classes [215 Eurotiomycetes (kingdom: Fungi), 336 Magnoliopsida (kingdom: Plantae), 350 Mammalia (kingdom: Animalia)] were obtained from NCBI and examined for diverse metrics including assembly size, GC content, frequency of A, T, C, and G, N50, N90, L50, L90, number of scaffolds, number of large scaffolds (defined as being greater than 500 nucleotides, which can be modified by the user), sum length of large scaffolds, and longest scaffold in the assembly. Bar plots represent the mean for each taxonomic class. Error bars represent the standard deviation of values. This figure was made using ggplot2 (Wickham 2009) and ggpubfigs (Steenwyk and Rokas 2021a).](https://oup.silverchair-cdn.com/oup/backfile/Content_public/Journal/genetics/221/3/10.1093_genetics_iyac079/2/m_iyac079f3.jpeg?Expires=1716383277&Signature=XfrCrjbKu81nTXVyc3QJiRZACdfLYyHxYbMQxZI1v1pcfqsm1~NnbRh9EkPTV7Jrn2v-Z64k-U5k5QLhjWh6doSkwyi43TtVHBSOKj5Cw4KD-zumM38Hrq30KAbabhFnKwgzxlGtv05YL2ak3uDyttLLodAQKwmuPmVl28p1DtRAjMzkJ78bgsjcKeCgs7hlXuwhV2JTn8N4qP83Z6wspYgkRQ1BBKBRXJs841vhsqycCIOykdmFVmxa7fjZaxGMbkPiTfFaMI~gTlA6BCSYIgrjgQq5c9pcq2J-PjtplSH3OFolYYoLazS2yu6XjGeYmqDGOD-mlGONLv0xw-GYIQ__&Key-Pair-Id=APKAIE5G5CRDK6RD3PGA)
Summary of genome assembly metrics across 901 genomes from 3 eukaryotic classes. Nine hundred and one scaffold-level genome assemblies from 3 major eukaryotic classes [215 Eurotiomycetes (kingdom: Fungi), 336 Magnoliopsida (kingdom: Plantae), 350 Mammalia (kingdom: Animalia)] were obtained from NCBI and examined for diverse metrics including assembly size, GC content, frequency of A, T, C, and G, N50, N90, L50, L90, number of scaffolds, number of large scaffolds (defined as being greater than 500 nucleotides, which can be modified by the user), sum length of large scaffolds, and longest scaffold in the assembly. Bar plots represent the mean for each taxonomic class. Error bars represent the standard deviation of values. This figure was made using ggplot2 (Wickham 2009) and ggpubfigs (Steenwyk and Rokas 2021a).
Properties of multiple sequence alignment from 10 phylogenomic studies
The properties of multiple sequence alignments are routinely used to evaluate aspects of alignment information content (Shen, Salichos, et al. 2016)—such as in phylogenomic and systematic studies (Oliveira et al. 2011; Pyron et al. 2013). To demonstrate the utility of BioKIT in calculating summary statistics for multiple sequence alignments, we calculated 6 properties across 10 previously published phylogenomic data matrices of amino acid sequences (Misof et al. 2014; Nagy et al. 2014; Borowiec et al. 2015; Chen et al. 2015; Struck et al. 2015; Whelan et al. 2015; Yang et al. 2015; Shen, Zhou, et al. 2016, 2018; Steenwyk et al. 2019) (Fig. 4). Phylogenomic data matrices varied in the number of taxa (mean = 109.50 ± 87.26; median = 94; max = 343; min = 36). Alignment length is associated with greater phylogenetic accuracy and bipartition support (Shen, Salichos, et al. 2016); however, recent analyses suggest that in some instances shorter alignments that contain a wealth of informative sites (such as parsimony-informative sites) harbor robust phylogenetic signal (Steenwyk et al. 2020). Interestingly, the longest observed alignment (1,806,035 sites; Chen, Vertebrates in Fig. 4) (Chen et al. 2015) contained the highest number of constant sites (N = 610,994), which are phylogenetically uninformative, as well as the highest number of variable sites (N = 1,195,041), which are phylogenetically informative (Shen, Salichos, et al. 2016). In contrast to the multiple sequence alignment of vertebrate sequences, the second longest alignment of budding yeast sequences (1,162,805 sites; Shen, 332 Yeast in Fig. 4) has few constant sites (N = 2,761) and many parsimony-informative (N = 1,152,145) and variable sites (N = 1,160,044). This observation may be driven in part by the rapid rate of budding yeast evolution compared to animals (Shen et al. 2018). These results demonstrate BioKIT is useful in summarizing properties of multiple sequence alignments.
Summary metrics among multiple sequence alignments from phylogenomic studies. Multiple sequence alignments of amino acid sequences from 10 phylogenomic data matrices (Misof et al. 2014; Nagy et al. 2014; Borowiec et al. 2015; Chen et al. 2015; Struck et al. 2015; Whelan et al. 2015; Yang et al. 2015; Shen, Zhou, et al. 2016; Shen et al. 2018; Steenwyk et al. 2019) were examined for 5 metrics: number of taxa, alignment length, number of constant sites, number of parsimony-informative sites, and number of variable sites. The x-axis depicts the last name of the first author of the phylogenomic study followed by a description of the organisms that were under study. The abbreviation PI represents parsimony-informative sites. Although excluded here for simplicity and clarity, BioKIT also determines character state frequency (nucleotide or amino acid) when summarizing alignment metrics. This figure was made using ggplot2 (Wickham 2009) and ggpubfigs (Steenwyk and Rokas 2021a).
Discussion
The exemplary analyses discussed in the present manuscript represent a small fraction of the ways to implement BioKIT. To further demonstrate how BioKIT may be used in multistep bioinformatic workflows, we depict how BioKIT can be incorporated into genome assembly workflows, genomic analysis pipelines, and phylogenomic workflows (Fig. 5). Taken together, these analyses demonstrate how BioKIT, alone or in tandem with other software, can facilitate the execution of diverse bioinformatic pipelines.
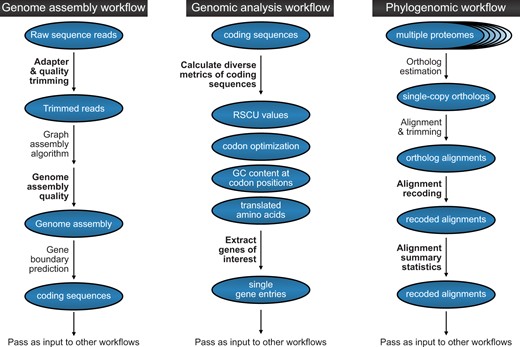
BioKIT can be incorporated into diverse bioinformatic workflows. This flowchart depicts how BioKIT can be incorporated into numerous bioinformatic pipeline using genome assembly (left), genome analysis (middle), and phylogenomic analysis (right) as examples. For each workflow, steps that can be executed by BioKIT are depicted in bold-faced font.
As noted throughout the manuscript, there are numerous other tools that perform similar functions to BioKIT. Our intent is not to replace these toolkits but provide a convenient package that conducts diverse analyses. Toolkits that conduct diverse analyses, like BioKIT, can help facilitate the long-term stability of bioinformatic workflows—such as those created using SnakeMake—by reducing the number of dependencies. We also believe BioKIT can be used as an effective teaching tool. The first step in teaching bioinformatics is often downloading and installing software, however, this step can be challenging and time-consuming due to lack of experience, differing installation requirements, and installation errors. Thus, BioKIT helps overcome this hurdle in the classroom.
Future releases of BioKIT will likely feature improvements in its scope and speed. BioKIT is a community-driven tool, thus, users are encouraged to request new functions or contribute their own. We recommend following standard GitHub operating procedures when doing so. In brief, new functions can be requested as GitHub issues and novel functions can be developed in a separate branch and then integrated into the main branch (or the distributed package). To help ensure long-term stability of BioKIT, users should write integration and unit tests for new functions prior to requesting to add them to the main branch. Beyond other functions, visualizing results will be considered in future releases of BioKIT. For the present manuscript, visualization of results was done with ggplot2 (Wickham 2009), pheatmap (Kolde 2012), and ggpubfigs (Steenwyk and Rokas 2021a) in the R programming language. Other future improvements may be related to the speed of BioKIT. Although numerous functions are relatively fast—for example, summarizing genome assembly metrics took 1.25 and 2.55 s for the genomes of S. cerevisiae and Aspergillus fumigatus—some functions, especially those that process large files, such as FASTQ files, may benefit from codebase modifications that improve speed. Speed improvements will likely be guided by user needs.
Conclusion
BioKIT is a multipurpose toolkit that has diverse applications for bioinformatics research. The utilities implemented in BioKIT aim to facilitate the execution of seamless bioinformatic workflows that handle diverse sequence file types. Implementation of state-of-the-art software development and design principles in BioKIT help ensure faithful function and archival stability. BioKIT will be helpful for bioinformaticians with varying levels of expertise and biologists from diverse disciplines including molecular biology.
Data availability
BioKIT is freely available under the MIT license from GitHub (https://github.com/JLSteenwyk/BioKIT), PyPi (https://pypi.org/project/jlsteenwyk-biokit/), and the Anaconda Cloud (https://anaconda.org/jlsteenwyk/jlsteenwyk-biokit). Documentation, user tutorials, and instructions for requesting new features are available online (https://jlsteenwyk.com/BioKIT).
Acknowledgments
We thank the Rokas lab for helpful discussion and feedback. We also thank the bioinformatic community for providing suggestions of functions to implement in BioKIT.
Funding
JLS and AR were funded by the Howard Hughes Medical Institute through the James H. Gilliam Fellowships for Advanced Study program. Research in AR’s lab is supported by grants from the National Science Foundation (DEB-1442113 and DEB-2110404), the National Institutes of Health/National Institute of Allergy and Infectious Diseases (R56 AI146096 and R01 AI153356), and the Burroughs Wellcome Fund.
Conflicts of interest
AR is a scientific consultant for LifeMine Therapeutics, Inc. JLS is a scientific consultant for Latch AI Inc.
Literature cited
Mesquite Project Team Mesquite. A Modular System for Evolutionary Analysis;
