-
PDF
- Split View
-
Views
-
Cite
Cite
Kai Xia, Andrey A Shabalin, Zhaoyu Yin, Wonil Chung, Patrick F Sullivan, Fred A Wright, Martin Styner, John H Gilmore, Rebecca C Santelli, Fei Zou, TwinEQTL: ultrafast and powerful association analysis for eQTL and GWAS in twin studies, Genetics, Volume 221, Issue 4, August 2022, iyac088, https://doi.org/10.1093/genetics/iyac088
Close - Share Icon Share
Abstract
We develop a computationally efficient alternative, TwinEQTL, to a linear mixed-effects model for twin genome-wide association study data. Instead of analyzing all twin samples together with linear mixed-effects model, TwinEQTL first splits twin samples into 2 independent groups on which multiple linear regression analysis can be validly performed separately, followed by an appropriate meta-analysis-like approach to combine the 2 nonindependent test results. Through mathematical derivations, we prove the validity of TwinEQTL algorithm and show that the correlation between 2 dependent test statistics at each single-nucleotide polymorphism is independent of its minor allele frequency. Thus, the correlation is constant across all single-nucleotide polymorphisms. Through simulations, we show empirically that TwinEQTL has well controlled type I error with negligible power loss compared with the gold-standard linear mixed-effects models. To accommodate expression quantitative loci analysis with twin subjects, we further implement TwinEQTL into an R package with much improved computational efficiency. Our approaches provide a significant leap in terms of computing speed for genome-wide association study and expression quantitative loci analysis with twin samples.
Introduction
For complex psychiatric disorders, such as schizophrenia and major depressive disorder, twin studies have received attention for establishing the general extent to which genes and environment are etiologically important (Neale and Cardon 1992; Boomsma et al. 2002; Silventoinen et al. 2003; Vaccarino et al. 2008; Chou et al. 2009; Park et al. 2012). Typical twin data include both monozygotic twins (MZ) and dizygotic twins (DZ), plus unpaired individual twins (singletons). Unlike data with independent samples, twin data require more careful statistical modeling since ignoring genetic relatedness and shared environment among twin pairs may lead to high false and/or low true positive findings. Several statistical approaches are available for twin data. One of the most common approaches is the linear mixed-effects model (LMM) where random effects are used to properly account for the correlations among subjects (Carlin et al. 2005; Wang et al. 2011; Kuna et al. 2012). Mixed-effects model have a well-established theory which is familiar to statisticians. Moreover, it is conveniently implemented in most statistical software and can flexibly adjust other nongenetic and genetic covariates (Ghazalpour et al. 2008; Rabe-Hesketh et al. 2008). Although single GWAS analysis using LMM is feasible by high performance computing (HPC), GWAS analysis of multiple traits such as expression quantitative loci (eQTL) studies where associations between thousands of transcripts and millions of single nucleotide polymorphisms (SNPs) are tested, mixed-effects models are extremely computationally inefficient if not practically impossible. The BOLT-LMM algorithm (Loh et al. 2015) rapidly computes statistics for association between phenotype and genotypes using an LMM by assuming a Bayesian mixture-of-normals prior for the random effect attributed to SNPs other than the one being tested, which provides an opportunity for increased power to detect associations while controlling false positives. However, it is only recommended to be used for human genetic datasets containing more than 5,000 samples. MatrixEQTL is an ultrafast R package for genome-wide association study with genetically unrelated subjects (Shabalin 2012) and it is not readily applicable to twin eQTL data. Previously, we have developed fast eQTL analysis method which use a score statistic that automatically adjusts the (hidden) correlation between the 2 correlated groups (Yin et al. 2015). However, this method requires reanalyzing the original data using HPC clusters.
A meta-analysis procedure, which uses only the SNP level GWAS summary statistics, is a popular approach for combining analysis results from multiple studies to increase power for detecting association findings. Meta-analysis has been used to integrate several GWAS studies (Evangelou and Ioannidis 2013) from multiple international institutes, and to GWAS of schizophrenia (Ripke et al. 2013, 2014), type 2 diabetes (Zeggini et al. 2008), polygenic dyslipidemia (Kathiresan et al. 2009), height (Allen et al. 2010), etc. It has also been mathematically and numerically proved that there is no efficiency gain in performing mega-analysis where full data with all individual level data are analyzed vs meta-analysis where only summarized test statistics are combined (Lin and Zeng 2010a, 2010b), which further popularizes the application of meta-analysis in GWAS. However, traditional meta-analysis requires independent studies without overlapping subjects or family members. For studies with overlapping subjects, it has been shown that failure to take the overlapping into consideration can lead to inflated type I errors and proper meta-analysis procedures are needed (Lin and Sullivan 2009). More recently, a meta-analysis of correlated traits method was proposed by Zhu et al. (2015), whose approach integrates correlated subjects and correlated traits in the same meta-analysis framework using 2 alternative approaches, SHom for homogeneous traits and SHet for heterogeneous traits. According to the homogeneous assumption, SHom can be directly applied to studies with correlated subjects such as twins where the correlation of test statistics is estimated empirically by Pearson’s correlation coefficient. However, the difference of correlation structures in MZ, DZ, and singleton are ignored and approximated, which could lead to power loss that cannot be afforded for large-scale twin GWAS and eQTL studies. Up to our best knowledge, no meta-analysis method has been specifically designed for elegantly modeling twin structures in eQTL and GWAS studies while reducing computational cost and keeping statistical power as high as using LMM. Cheung (2014, 2018) adapted a structure equation modeling approach to model complicated variance–covariance structure among correlated traits or subjects, which can also be applied to GWAS studies with twins. However, it is always a judgment call to check the assumption of homogeneity or heterogeneity of variance–covariance matrix.
In this study, we propose a computationally efficient and statistical powerful approach in twin GWAS/eQTL analysis, TwinEQTL, that boosts the computing efficiency from thousands of folds (Yin et al. 2015) to 10,000 folds compared with LMM. Similar to previous approach (Zhu et al. 2015), TwinEQTL algorithm was derived by adjusting variance–covariance structure in the meta-analysis model when combining correlated test statistics. In addition, by modeling the difference of correlation structures in MZ and DZ pairs, the correlation between test statistics can be more accurately estimated using only 1 run of LMM per phenotype, without iterating all the combinations of both phenotype and SNPs. Furthermore, TwinEQTL is implemented in a fashion similar to the currently one of the fastest engines for GWAS, MatrixEQTL, while taking the correlation structure of both MZ and DZ twins into consideration by mimicking meta-analysis procedure in GWAS. In TwinEQTL pipeline, we first split twin pairs and singletons into 2 independent sets, so that within each set the samples are unrelated and a linear regression is performed separately for each set. We then combine the 2 nonindependent test statistics through a meta-analysis where the correlation between the 2 sets of results is adjusted. Our method avoids the iterative use of LMM with substantially reduced computing time. When Pearson’s correlation coefficient is used to empirically approximate the correlation between test statistics, TwinEQTL is equivalent to SHom at the cost of power loss in many scenarios according to simulations. We performed a series of simulations to demonstrate that TwinEQTL is robust to various correlation structures in twin samples while maintaining superior statistical power compared with competing methods.
Materials and methods
TwinEQTL without covariates
Alternatively, Zhu et al. (2015) proposed to empirically estimate by the sample correlation of T1 and T2 across all tested SNPs. As the number of SNPs can be large for modern GWAS data, we may choose to calculate the sample correlation of T1 and T2 across a few thousands of randomly selected SNPs. The performance of both methods was evaluated through simulations.
TwinEQTL with covariates
As discussed in Shabalin (2012), the multiple linear regression can be reduced to simple linear regression when testing for the SNP effect by regressing the response variable and the SNP genotypes relative to the other covariates, from which the residuals are obtained and used for the subsequent simple linear regression. Following the similar argument, we can show that the correlation between the 2 sets of t statistics will be constant across all SNPs and is independent of the MAF of each SNP, when the covariates and the SNP genotypes are not correlated, which should be true for most of the SNPs, or approximately true for all SNPs.
Linear mixed-effect model
LMM is considered as a gold standard for analyzing twin data and multivariate phenotypes. In this paper, we compare the performances of the proposed method with LMM. For twin data, we implemented LMM as described in Wright et al. (2014) which distinguishes MZ and DZ twins by considering additive genetic effect (A), shared environment effect (C), and unique environment effect [aka the ACE model (Neale and Cardon 1992)].
GWAS of brain volume in neonates
The GWAS study of early brain development study (EBDS) at UNC-Chapel Hill was to investigate how genetic variation impacts prenatal and early postnatal brain development of global brain tissue volumes in a unique cohort of infants who received high-resolution MRI scans of the brain around 5 weeks of age (Xia et al. 2017).
The SNP genotypes were generated from Affymetrix Axiome World Array 4.0 on 852 infants with their buccal samples. A total of 756 infants and 854,979 SNPs were obtained after the following quality control steps [see more details in Xia et al. (2017)]: we excluded samples with low DishQC (<0.82), low call rates (), outliers for homozygosity, sex, or zygosity from genotypes inconsistent with reported phenotypes, ancestry outliers, excessive relatedness, and unexpected relatedness. We removed individual SNPs that deviated from Hardy–Weinberg equilibrium (HWE) (), had low call rate (<95%), high Mendelian error rate (>0.1, based on 5 parent–child trios), high deviation of allele frequency compared with European American and African American subsets from the 1000 Genomes Project. Imputation was performed with MACH-Admix using the 1000 Genomes Project (1000G) reference panel (phase1 release v3.20101123). To evaluate the quality of imputed SNPs, we computed mean R2 for varying MAF categories and R2 cutoffs. We retained SNPs with mean and excluded SNPs with MAF < 0.01. A total of 561 infants (300 male, 261 female) between 0 and 24 weeks of age, encompassing 295 singletons or unpaired twins, 17 sibling pairs and 232 twins [61 same-sex dizygotic (DZ) pairs, 37 same-sex monozygotic (MZ) pairs and 18 opposite-sex DZ pairs]. Overall, 63% of subjects are Europeans with remaining subjects being primarily Africans. The MRI measurements of brain volume include white matter (WM), intracranial volume (ICV), gray matter (GM), and total cerebrospinal fluid (CSF).
The genome-wide association analysis using linear regression is not valid due to the correlation among twins. Instead, the LMM was used in the original study by utilizing HPC cluster. The first 3 genotypic principal components (PCs) were included as covariates to control for population stratification, so was scanner type to control for potential scanner bias. ICV was included as a covariate for GM, WM, and CSF. Additional covariates were selected via adaptive LASSO from a comprehensive set of demographic and medical history variables (Xia et al. 2017) including birth weight, gestational age at birth, sex, and age at MRI.
Netherlands Twin Registry eQTL Study
In Netherlands Twin Registry (NTR) twin study (dbGaP study accession number: phs000486.v1.p1), 2,752 individuals had their SNP genotypes and gene expression data measured (Wright et al. 2014) on Affymetrix Genome-Wide Human SNP Array 6.0 and Affymetrix u219 array, respectively. One of the goals of this project is to identify a comprehensive list of eQTL in peripheral blood and their biological significance. After a series of quality control steps described previously in Wright et al. (2014), a total of 642,489 autosomal SNPs and 47,495 transcripts on 2,561 individuals were kept for the eQTL analysis, which include 641 MZ pairs, 564 DZ pairs, and 151 singletons. A total of 16 covariates including the age at blood sampling, sex, smoking status, body mass index, hematocrit count, hemoglobin count and total white and red cell counts, 5 PCs from the gene expression data, and 3 PCs derived from the pruned genotype data are also included as covariates.
Results
Simulation studies
For simulation analysis, genotypes of MZ and DZ twins were simulated with the following manners: For a given SNP, its MAF was first sampled from a uniform distribution of . Then for each twin pair, 2 maternal alleles and 2 paternal alleles were independently and randomly generated from the Bernoulli distribution with the sampled MAF. If the twin pair is an MZ pair, their identical genotype was generated by combining one randomly sampled maternal allele and one randomly sampled paternal allele. If it is a DZ pair, each sample’s genotype was separately created by merging one randomly selected maternal allele and one randomly selected paternal allele.
Type I error simulations.
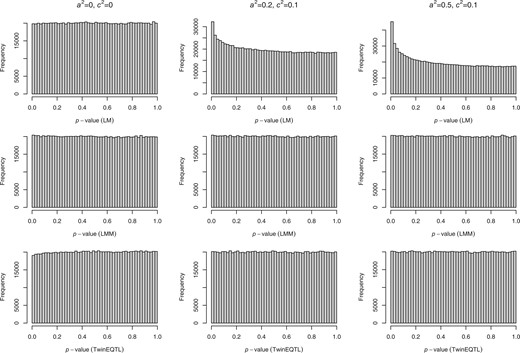
We simulated 500 MZ twins, 500 DZ twins and 100 or 1,000 singletons under different scenario of genetic (a2) and shared environmental effect (c2). Table 1 shows the empirical type I errors of SHom, TwinEQTL, LMM, and naive linear method (LM) without correcting for correlation among twin subjects at different significance levels α and 6 scenarios of different genetic and environmental effects. One million simulations were done in each scenario. The results suggest that when naive LM is directly applied to simulated twin samples, type I errors can be highly inflated if additive genetic effects and/or shared environmental effects are present. The empirical type I error also increases as a2 and c2 increase. In contrast, SHom, TwinEQTL, and LMM control the type I errors well under different scenarios. The histograms of the P-values from the 3 approaches are shown in Fig. 1. Clearly, that P-values from TwinEQTL and LMM are uniformly distributed while the P-values from naive LM are enriched closed to 0.
Distributions of P-value under H0 for different scenarios of a2 and c2. The comparisons of distributions of P-value under different scenarios of additive genetic effect (a2) and shared environment effect (c2) using linear model (top panel), LMM (middle panel) and TwinEQTL (bottom panel). For linear model method, both subjects in each twin pair and all the singletons were used ignoring correlation structure within each twin pair. The number of MZ and DZ are balance () and the number of singletons are relatively small (nSg = 100) in this case.
Type I errors of twin data using LM, LMM, and TwinEQTL.
| . | . | . | . | . | |||||||||
|---|---|---|---|---|---|---|---|---|---|---|---|---|---|
| a2 . | c2 . | LM . | LMM . | SHom . | TwinEQTL . | LM . | LMM . | SHom . | TwinEQTL . | LM . | LMM . | SHom . | TwinEQTL . |
| 0 | 0 | 0.010 | 0.010 | 0.010 | 0.009 | 0.0009 | 0.0010 | 0.0010 | 0.0009 | 0.00008 | 0.00009 | 0.00008 | 0.00007 |
| 0.2 | 0.1 | 0.018 | 0.010 | 0.010 | 0.010 | 0.0024 | 0.0009 | 0.0010 | 0.0010 | 0.00029 | 0.00009 | 0.00009 | 0.00009 |
| 0.5 | 0.1 | 0.027 | 0.010 | 0.010 | 0.010 | 0.0045 | 0.0010 | 0.0010 | 0.0010 | 0.00076 | 0.00009 | 0.00010 | 0.00010 |
| 0.7 | 0.2 | 0.037 | 0.010 | 0.010 | 0.010 | 0.0077 | 0.0010 | 0.0010 | 0.0010 | 0.00161 | 0.00009 | 0.00010 | 0.00010 |
| 0.9 | 0 | 0.036 | 0.010 | 0.010 | 0.010 | 0.0073 | 0.0009 | 0.0010 | 0.0010 | 0.00149 | 0.00009 | 0.00010 | 0.00010 |
Power simulations
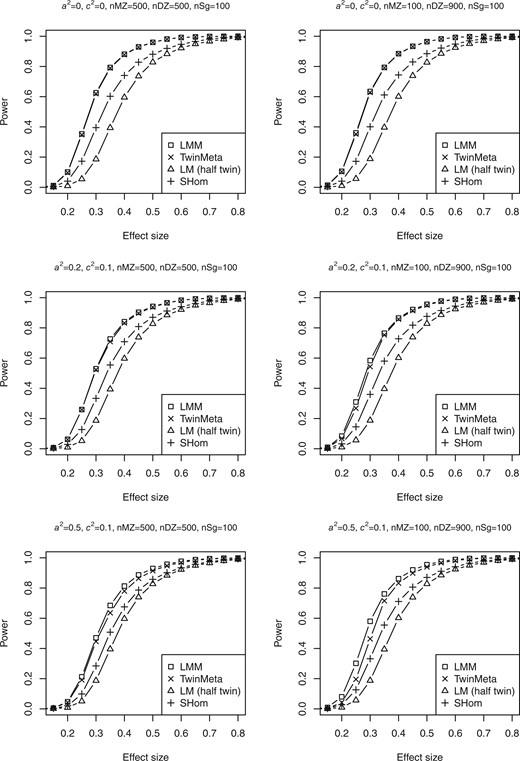
Similar setups as above in type I error investigation are also used to estimate statistical power. For twin data, since naive LM has inflated power, for each simulated data, we randomly select a subset of samples with a largest number of unrelated samples (i.e. 600 subjects including 100 singletons and one half of total 1,000 twins) on which the linear regression model is valid. Power estimations of LM from the independent subset, SHom TwinEQTL and LMM are shown in Fig. 2. A total of 10,000 simulations were done in each scenario. Significant power loss is observed in LM where only a subset of subjects is analyzed. We choose significance level of in the power analysis in order to recreate the scenarios close to real data analysis in GWAs/eQTL. The power estimates of TwinEQTL and LMM are similar to each other in most cases while SHom has clear power disadvantage, especially when additive genetic effect is relatively low and when the DZ are dominate in the samples. Furthermore, we performed additional simulations under various scenarios of a2 and c2, DZ/MZ ratios, significance levels. The results indicate TwinEQTL is a good alternative to LMM at much lower computational cost (Supplementary Fig. 1).
Power estimations for twin data with different scenarios of a2 and c2. The power analysis at significance level of under different scenarios of sample size, effect size, additive genetic effect (a2), and shared environmental effect (c2). For linear model method, only one subject per twin pair and all the singletons were used in the regression model. The left panel shows the estimated power under circumstance that the number of MZ and DZ are balance ( and nSg = 100). The right panel shows the estimated power under circumstance that the number of MZ and DZ are imbalance (nMZ = 100, nDZ = 900, and nSg = 100)
Application in GWAS of brain MRI imaging
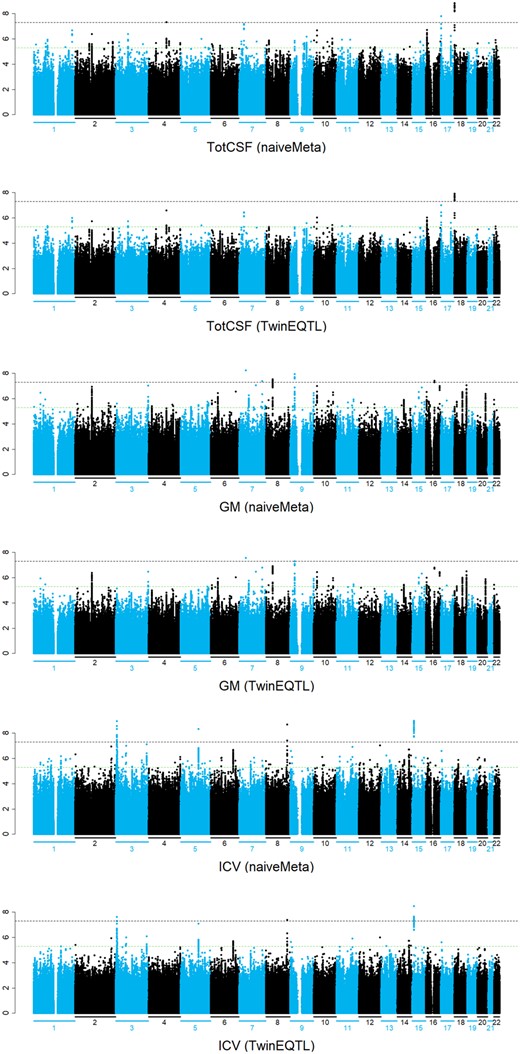
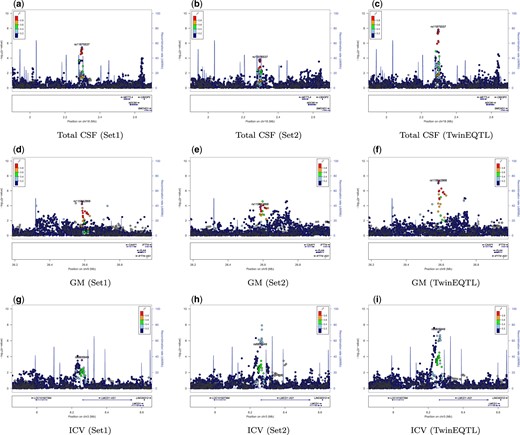
We also applied TwinEQTL to the GWAS study of brain volume in neonates, which investigate the association between neonatal total GM volume, CSF volume, and ICV with genome-wide genetic markers in a twin study. A total of 561 infants (300 male, 261 female) between 0 and 24 weeks of age, encompassing 295 singletons or unpaired twins, 17 sibling pairs, and 232 twins. To perform valid genome-wide association analysis without inflated type I error, we first randomly split the subjects into set1 and set2 while restricting twin/sibling pairs to be separated into set1 and set2. So, within each subset, subjects are independent with each other and subjects between subsets are correlated because of shared families. We then performed TwinEQTL by 2 steps: (1) perform linear regression for both set1 and set2 separately; (2) combining the summary statistics from 2 subsets using either TwinEQTL algorithm or naive meta-analysis without controlling for correlation. Figure 3 shows the genome-wide results of naive meta-analysis and TwinEQTL. Overall P-values from naive meta-analysis are much lower compared with those from TwinEQTL due to poor type I error control which we shown in simulations. Figure 4 shows the advantage of TwinEQTL during this procedure. P-values from set1 and set2 are suggestive but nowhere near to genome-wide significant when analyzed separately. After meta analyzed using TwinEQTL, association turns out to be genome-wide significant. More specifically, variant rs11875537, which resides downstream of METTL4, was found significantly associated with total CSF volume using TwinEQTL. Interestingly, METTL4 show elevated prenatal expression in a small subset of brain regions. By examining exon level expression data from Brainspan, we found METTL4 has specific isoforms with differentially regulated expression across the lifespan (Kang et al. 2011). Similarly, another variant rs115842868, which resides downstream of CAAP1, was found significantly associated with GM volume. By checking with human brain atlas, we also found that CAAP1 is also preferentially expressed in several brain tissues (Shen et al. 2012). We also found that the protein expression level of LMCD1 is highest in cerebellum among all the tissues (Shen et al. 2012). In addition, variant rs6805949, which resides downstream of LMCD1, was found significantly associated with ICV. All of these evidences suggest the potential power of TwinEQTL in identifying biological factors related to brain development.
Manhattan plot of GWAS study of neonatal CSF (top panels), GM (middle panels), and ICV (bottom panels) using either naive meta-analysis (not controlling for correlation structure between twins) or TwinEQTL (controlling for correlation structure between twins). The results using naive meta-analysis show overestimated significant findings due to inflated type I error.
LocusZoom plot of genome-wide association analysis of neonatal GM, CSF, and ICV. GWAS P-values of neonatal CSF ( top panels: a-c), GM (middle panels: d-f), and ICV (bottom panels: g-i) in EBDS study. The GWAS analysis performed separately using independent set 1 (left panels), independent set 2 (middle panels) and then combined set 1 and set 2 using TwinEQTL (right panels). The significance of P-values in set1 and set2 is augmented by TwinEQTL even though they were not significant in results using only set1 or set2.
Application in NTR twin eQTL study
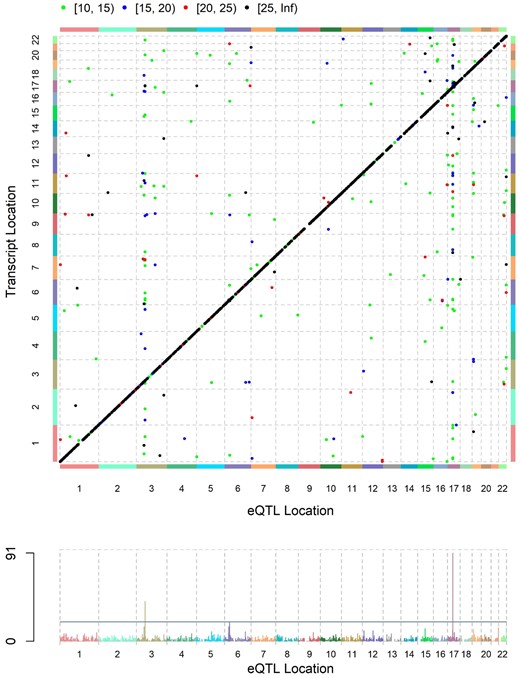
We applied TwinEQTL to our previously published eQTL analysis of NTR twin data (Wright et al. 2014). Due to computational limitation of standard LMM in our previous study, we could only afford to apply LMM–ACE model to a subset of SNP–gene pairs. As a compromise, we used 2-step approach to perform eQTL analysis with twin subjects: (1) perform fast eQTL analysis with MatrixEQTL using linear model while ignoring twin status; (2) perform eQTL analysis only on significant eQTLs from first step with valid but slow LMM–ACE model. With TwinEQTL method, we are able to compute both local and distal eQTLs in 1 step and all pairs of SNP–transcripts associations were computed in <2 h. The SNP–transcripts associations with P-values passing certain thresholds are shown in the eQTL plot (Fig. 5). In summary, we were able to identify consistent set of eQTL genes with much less computing time using TwinEQTL method.
eQTL plot for the SNP–transcript association using TwinEQTL method. The diagonal line shows genome-wide strong local eQTLs and other scattered dots are intra- or interchromosomal distal eQTLs.
Algorithm performance
We performed speed analysis in PC with 64-bit Windows 10, Intel Xeon E3-1225 CPU, 3.30 GHz, 32 GB RAM and MS R Open version 4.0.2 (64 bit). We compared our method with LMM–ACE model using GWAS dataset of UNC-Chapel Hill EBDS with only genotyped SNPs (m = 854,979). Our estimate shows it took more than 73 h for LMM–ACE using R, and it took about 1 h for BOLT-LMM to complete same task under High Performance Cluster. By implementing TwinEQTL using both accelerated estimation for ACE model (Chen et al. 2019) and efficient matrix multiplication method behind MatrixEQTL (Shabalin 2012), the computing time is reduced to only 22 s once the data has been loaded in R, which is more than 10,000 times increase in computational efficiency compared with LMM–ACE model. To assess the computational performance of TwinEQTL with realistic settings, we simulated eQTL data under different sample sizes (), number of SNPs (), and various variance components within a normal range. The average computational time with 20K transcripts is shown in Table 2, suggesting that the computational complexity of TwinEQTL is linear in N and P, which is practical for real world GWAS and expression data. The results also suggest that it is acceptable to run eQTL analysis when sample size is <2K. However, when sample size is as large as 5K, a few HPC nodes is recommended for such analysis.
Computational performance of TwinEQTL for eQTL analysis.
| . | Estimated time (hours)a . | ||
|---|---|---|---|
| Sample size (Nb) . | 500K SNPs . | 1M SNPs . | 2M SNPs . |
| 500 | 2.3 | 4.5 | 18.3 |
| 1,000 | 3.8 | 9.9 | 32.1 |
| 2,000 | 9.0 | 15.4 | 36.3 |
| 5,000 | 22.9 | 42.6 | 91.5 |
| 10,000 | 52.3 | 90.0 | 180.5 |
| . | Estimated time (hours)a . | ||
|---|---|---|---|
| Sample size (Nb) . | 500K SNPs . | 1M SNPs . | 2M SNPs . |
| 500 | 2.3 | 4.5 | 18.3 |
| 1,000 | 3.8 | 9.9 | 32.1 |
| 2,000 | 9.0 | 15.4 | 36.3 |
| 5,000 | 22.9 | 42.6 | 91.5 |
| 10,000 | 52.3 | 90.0 | 180.5 |
eQTL analysis using 20,000 simulated gene expression values.
The ratio of MZ vs DZ is 1:1 with 80% of twins in total.
Discussion
We provided a novel and simple approach, TwinEQTL for both GWAS and eQTL studies with correlated twin subjects. Our approach is significantly faster than traditional method such as LMM and our previous fast alternative (Yin et al. 2015). TwinEQTL only needs to estimate the correlation once per trait with LMM–ACE, instead of performing LMM each per SNP–trait pair for millions of times in a typical GWAS. Similar to SHom (Zhu et al. 2015), TwinEQTL uses meta-analysis-like approach to combine test statistics from related subjects, while adjusting for correlation between them, but offers a more accurate correlation estimate and a much faster implementation for twin GWAS. The method is especially useful for twin eQTL analysis, where LMM is prohibited.
There are several limitations that must be considered when using TwinEQTL. First, the current implementation of TwinEQTL only deals with continuous traits or gene expressions. Other types of responses could be implemented in the future if there is any demand. Secondly, TwinEQTL does not account for responses with complicated structure such as longitudinal observations or studies with multilevel family structures, which could be estimated through general linear model with correctly specified variance–covariance component such as compound symmetry, autoregressive model, unstructure, etc., or alternatively using more robust estimation method such as generalized estimating equations. Compared with LMM, statistically, TwinEQTL is expected to experience some efficiency loss unless or nDZ = 0, which agrees with the findings on mega-analysis vs meta-analysis in (Lin and Sullivan 2009; Lin and Zeng 2010b). We have conducted extensive simulations for a wide range of values of and to empirically demonstrate that the power loss of TwinEQTL is acceptable for practical use given its tremendous computational gain (Supplementary Fig. 1). Furthermore, TwinEQTL requires splitting samples into 2 independent subsets, which could potentially create imbalance of MAF between 2 subsets. This can be problematic for variants with low allele frequency and small sample size because rare variants can become rarer in each subset and will have more leverages to be more influential in the association analysis and might potentially create artifacts by having single extreme outlier (Chatterjee and Hadi 1986). Similar issues have been observed in our own analysis when comparing the GWAS results of TwinEQTL with those from LMM (Xia et al. 2017), where top hits in CSF GWAS on chromosome 18 from TwinEQTL were not found by LMM and top hit in GM GWAS on chromosome 4 from LMM was missed by TwinEQTL. Lastly, according to our simulations, TwinEQTL performs best when most of the subjects are twins in the study. However, when more than half of the subjects are independent, neither LMM nor TwinEQTL have overwhelming power advantage over linear regression with only independent subset. As a result, for study that was not designed specifically for twin, the easiest approach to deal with sporadic twin subjects is just simply select one subject from each twin pair followed by linear regression. However, for twin pairs with substantial portion, TwinEQTL should be the most suitable method.
Data availability
The authors affirm that all data necessary for confirming the conclusions of the article are present within the article, figures, and tables.
TwinEQTL is implemented in R and is available and maintained under GitHub website https://github.com/andreyshabalin/TwinEQTL. The required input data by TwinEQTL includes genotype data, gene expression data, covariates data and twin status data.
Supplemental material is available at GENETICS online.
Conflicts of interest
None declared.
Literature cited
Appendix
where gik and yik are the corresponding genotype and phenotype of subject in group k, and the random error . For simplification, we assume that both y and g are standardized to have mean 0 and variance 1 within each group.
if IBD = 0, and are essentially independent of each other so ;
if IBD = 2, and Z are identical, so ;
- if IBD = 1, and share 1 allele IBD, so we have(13)
where x, y, and z are the constituting alleles of the 2 twin samples and each follows Bernoulli(f).
where , which is the correlation between T1 and T2, with T1 and T2 corresponding t-statistics from the set1 and set2 data, respectively. Under .
Author notes
Kai Xia and Andrey A Shabalin contributed equally to this work.


