


Abstract
Tocochromanols (tocopherols and tocotrienols, collectively vitamin E) are lipid-soluble antioxidants important for both plant fitness and human health. The main dietary sources of vitamin E are seed oils that often accumulate high levels of tocopherol isoforms with lower vitamin E activity. The tocochromanol biosynthetic pathway is conserved across plant species but an integrated view of the genes and mechanisms underlying natural variation of tocochromanol levels in seed of most cereal crops remains limited. To address this issue, we utilized the high mapping resolution of the maize Ames panel of ∼1,500 inbred lines scored with 12.2 million single-nucleotide polymorphisms to generate metabolomic (mature grain tocochromanols) and transcriptomic (developing grain) data sets for genetic mapping. By combining results from genome- and transcriptome-wide association studies, we identified a total of 13 candidate causal gene loci, including 5 that had not been previously associated with maize grain tocochromanols: 4 biosynthetic genes (arodeH2 paralog, dxs1, vte5, and vte7) and a plastid S-adenosyl methionine transporter (samt1). Expression quantitative trait locus (eQTL) mapping of these 13 gene loci revealed that they are predominantly regulated by cis-eQTL. Through a joint statistical analysis, we implicated cis-acting variants as responsible for colocalized eQTL and GWAS association signals. Our multiomics approach provided increased statistical power and mapping resolution to enable a detailed characterization of the genetic and regulatory architecture underlying tocochromanol accumulation in maize grain and provided insights for ongoing biofortification efforts to breed and/or engineer vitamin E and antioxidant levels in maize and other cereals.
Introduction
Tocochromanols, which include the biosynthetically related tocopherols and tocotrienols, are a group of plant-synthesized lipid-soluble antioxidants that have a chromanol ring derived from homogentisic acid (HGA) and isoprenoid-derived hydrophobic side chains. The saturated side chain of tocopherols is derived from phytyl-diphosphate (PDP), whereas the tocotrienol side chain has 3 double bonds and is derived from geranylgeranyl diphosphate (GGDP). Tocopherols and tocotrienols occur as 4 biosynthetically related isoforms (α, β, δ, and γ) that vary in the degree and position of methyl groups on their chromanol rings. Among the tocochromanols, α-tocopherol has the highest vitamin E activity (DellaPenna and Mène-Saffrané 2011), while tocotrienols tend to have greater antioxidant activity (Sen et al. 2006). Although severe vitamin E deficiency leading to ataxia and myopathy is rare in human populations (Traber 2012), suboptimal dietary vitamin E intake exists in certain population segments (Ford et al. 2006; McBurney et al. 2015) and has been linked to an elevated risk of cardiovascular diseases (Knekt et al. 1994; Kushi et al. 1996). Tocochromanols are found at high levels in plant seeds where they confer protection against lipid peroxidation during seed storage and germination (Sattler et al. 2004). However, α-tocopherol is not the major tocochromanol in most cereal seed oils, which limits the dietary vitamin E intake of both humans and animals (DellaPenna and Mène-Saffrané 2011).
Tocochromanols are only synthesized by photosynthetic organisms, and the tocochromanol biosynthetic pathway is highly conserved in the plant kingdom (DellaPenna and Mène-Saffrané 2011). In the committed step of tocopherol synthesis (Fig. 1), a homogentisate phytyltransferase (VTE2) condenses PDP and HGA from the shikimate pathway to produce 2-methyl-6-phytyl-1,4-benzoquinol (MPBQ) (Sattler et al. 2004). In the monocot lineage, HGA can also be condensed with GGDP by homogentisate geranylgeranyltransferase (HGGT1) to generate 2-methyl-6-geranylgeranyl-1,4-benzoquinol (MGGBQ), the committed step for tocotrienol synthesis. MPBQ and MGGBQ are substrates for a series of methylations by MPBQ/MGGBQ methyltransferase (VTE3) and γ-tocopherol methyltransferase (VTE4) and cyclization by tocopherol cyclase (VTE1), whose sequence and numbers of reactions generate the α, β, δ, and γ isoforms of tocopherols and tocotrienols (Shintani and DellaPenna 1998; Porfirova et al. 2002; Cheng et al. 2003; Van Eenennaam et al. 2003; Sattler et al. 2004). While GGDP for tocotrienol synthesis comes directly from the isoprenoid pathway, the generation of PDP for tocopherol synthesis is more complex and still not completely resolved. Though differences in leaf tocopherol synthesis exist between monocots and dicots, tocopherol synthesized in seed requires chlorophyll biosynthesis (Diepenbrock et al. 2017; Zhan et al. 2019) and the activity of VTE7, an alpha/beta hydrolase that interfaces with chlorophyll synthesis to release phytol (Albert et al. 2022). Phytol is then sequentially phosphorylated to PDP through the action of phytol kinase (VTE5) and phytol phosphate kinase (VTE6) (Valentin et al. 2006; Vom Dorp et al. 2015).
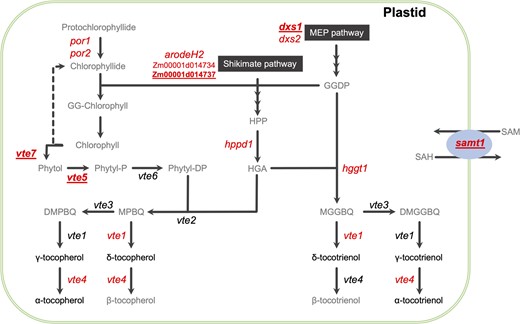
Tocochromanol biosynthetic pathways in maize. The 2 precursor pathways are represented as black boxes. The 6 quantified compounds are indicated in black nonitalicized text. The names of key a priori genes are italicized at the pathway step(s) catalyzed by their encoded enzyme, with the 13 candidate causal gene loci identified in this study in red text. The 5 genes not previously shown to be associated with tocochromanols in maize grain are red, bolded, and underlined. Compound abbreviations: DMGGBQ, 2,3-dimethyl-5-geranylgeranyl-1,4-benzoquinol; DMPBQ, 2,3-dimethyl-6-phytyl-1,4-benzoquinol; GGDP, geranylgeranyl diphosphate; GG-Chlorophyll, geranylgeranyl-chlorophyll a; HGA, homogentisic acid; HPP, p-hydroxyphenylpyruvate; MEP, methylerythritol 4-phosphate; MGGBQ, 2-methyl-6-geranylgeranyl-1,4-benzoquinol; MPBQ, 2-methyl-6-phytyl-1,4-benzoquinol; Phytyl-DP, phytyl diphosphate; Phytyl-P, phytyl monophosphate; SAM, S-adenosyl-l-methionine; SAH, S-adenosyl-l-homocysteine. Gene abbreviations: 1-deoxy-d-xylulose-5-phosphate synthase (dxs1 and 2); α-/β-hydrolase family protein (vte7); arogenate/prephenate dehydrogenase family protein (arodeH2); phytol kinase (vte5); phytol phosphate kinase (vte6); p-hydroxyphenylpyruvate dioxygenase (hppd1); protochlorophyllide reductase (por1 and 2); homogentisate geranylgeranyltransferase (hggt1); homogentisate phytyltransferase (vte2); MPBQ/MGGBQ methyltransferase (vte3); γ-tocopherol methyltransferase (vte4); S-adenosylmethionine transporter 1 (samt1); tocopherol cyclase (vte1). The vte7 locus consists of tandemly duplicated genes (Zm00001d006778 and Zm00001d006779) in B73 RefGen_v4.
In the past decade, several loci associated with natural variation for the content and composition of tocochromanols in maize grain have been identified via genome-wide association studies (GWAS) in mapping panels. Several studies have reported strong associations between vte4 and α-tocopherol concentration in maize grain (Li et al. 2012; Lipka et al. 2013; Wang et al. 2018; Baseggio et al. 2019), with relatively weaker associations detected for vte1, hggt1, and an arogenate/prephenate dehydratase with maize grain tocotrienol levels (Lipka et al. 2013; Baseggio et al. 2019). Wang et al. (2018) implicated genes outside of the core tocochromanol biosynthetic pathway as playing a role in maize grain tocopherol levels, including genes involved in fatty acid biosynthesis, chlorophyll metabolism, and chloroplast function. While these combined studies provided some insight into the genetic basis of tocochromanol levels in maize grain, these studies were limited by mapping panel size and marker density.
Through a joint-linkage (JL) analysis and GWAS in the 5,000-line US maize nested association mapping (NAM) panel with high statistical power, Diepenbrock et al. (2017) identified 50 unique QTL for tocochromanol grain traits. Of these, 13 QTL were resolved to 7 a priori pathway genes (dxs2, sds, arodeH2, hppd1, hggt1, vte3, and vte4) and 6 nonpathway genes (por1, por2, snare, ltp, phd, and fbn) that encoded predicted functions not previously associated with tocochromanol traits. Although maize grain is a nongreen, nonphotosynthetic tissue, 2 protochlorophyllide reductases (POR1 and POR2) were found to be major loci controlling total tocopherols and were hypothesized to be part of a cycle that provides chlorophyll-derived phytol for tocopherol synthesis in the maize embryo, which contain exceedingly low, but detectable, levels of chlorophylls. The involvement of por2 in tocopherol accumulation in maize grain was transgenically confirmed by overexpression (Zhan et al. 2019). Although the US NAM panel provided unparalleled mapping resolution for these 13 QTL, 37 QTL for tocochromanols with moderate effects or limited contrasting genotypes in the NAM panel could not be resolved to the gene level, thus other mapping approaches combined with more diverse mapping panels could have substantial utility in identifying additional underlying candidate causal genes.
For terminal phenotypes such as grain tocochromanols, intermediate phenotypes or endophenotypes can offer orthogonal genetic information to better connect genotype to phenotype. In a gene-based association approach that can generate insights into biological processes, a transcriptome-wide association study (TWAS) correlates mRNA abundance with complex trait variation, which allows for the statistical connection of an intermediate phenotype to a terminal phenotype (Hirsch et al. 2014; Lin et al. 2017; Pasaniuc and Price 2017; Li et al. 2021). In an assessment of TWAS for the genetic dissection of tocochromanol and carotenoid maize grain traits in the Goodman-Buckler association panel, Kremling et al. (2019) showed that the statistical power to detect previously identified causal genes could be increased through an ensemble approach combining GWAS and TWAS results with the Fisher’s combined test (FCT). Additionally, this approach was used to identify plausible causal genes associated with natural variation for water use efficiency traits in sorghum (Ferguson et al. 2021; Pignon et al. 2021). The genetic markers used in GWAS could also be linked to mRNA abundance via expression quantitative trait locus (eQTL) mapping (Majewski and Pastinen 2011), enabling the regulatory landscape of traits to be better explored as has been conducted for oil content and composition in maize grain (Li et al. 2013).
In this study, we conducted a comprehensive genetic dissection of tocochromanol grain phenotypes in a large maize association panel (∼1,500 inbreds) that leveraged the scoring of ∼12.2 million SNP markers and transcript abundances of more than 22,000 genes from developing grain. Our integrated GWAS and TWAS approach combined with eQTL mapping to pinpoint multiple candidate causal genes and uncover their regulatory control.
Materials and methods
Experimental design for genetic mapping
A collection of 1,815 maize inbred lines from the Ames panel (Romay et al. 2013) was grown as a single replicate at Iowa State University in Ames, IA, in 2015 and 2017. The Ames panel was arranged in an augmented complete block design. For each year, 2 blocking directions were assigned: each range block consisted of 3 adjacent rows of plots, and each pass block consisted of 8 adjacent columns of plots. At least one B73 check plot was planted within each pass and range block. The inbred lines were grouped into 2 and 3 tiers for 2015 and 2017, respectively, according to their days to silking (flowering time) recorded in Romay et al. (2013) for the 2015 design and pollination date in 2015 for the 2017 design. Experimental units were 1-row 3.05 m plots having ∼18 plants, with 0.76 m inter-row spacing and a 0.76 m alley. Approximately 6 plants per plot were self-pollinated and hand-harvested at physiological maturity. The kernels from all dried and shelled ears were bulked to form a representative sample. For each plot, 25 kernels were ground in an IKA Tube Mill Control (IKA-Werke, Staufen, Germany) and ground tissue stored in cryovials at −80°C.
Phenotypic data analysis
The extraction of tocochromanols from 15 to 20 mg of ground kernels and their quantification by high-performance liquid chromatography (HPLC) and fluorometry were as previously described (Lipka et al. 2013). Briefly, tocopherols and tocotrienols were assessed on 3,539 grain samples from 1,762 inbred lines and the repeated B73 check plots. The 9 evaluated tocopherol and tocotrienol phenotypes in μg g−1 dry seed were as follows: α-tocopherol (αT), δ-tocopherol (δT), γ-tocopherol (γT), α-tocotrienol (αT3), δ-tocotrienol (δT3), γ-tocotrienol (γT3), total tocopherols (ΣT, calculated as αT + δT + γT), total tocotrienols (ΣT3, calculated as αT3 + δT3 + γT3), and total tocochromanols (ΣTT3, calculated as ΣT + ΣT3). Statistical outliers were identified and filtered from the raw HPLC data, followed by a mixed linear model analysis that modeled genetic and nongenetic (field and laboratory) effects to produce best linear unbiased estimator (BLUE) values for the 1,762 inbred lines (Supplementary Table 1) and heritability estimates as described in the Supplementary Methods. Considering that morphologically extreme grain types can potentially have inflated tocochromanol concentrations based on a dry sample weight basis, we conservatively excluded 265 inbred lines that had been classified as sweet corn, popcorn, or having other endosperm mutations.
Genotypic data
We used the genotype data processing and BEAGLE v5.0 (Browning et al. 2018) imputation approaches implemented by Wu et al. (2021) as described in the Supplementary Methods. The generated imputed marker data set for enabling GWAS of 1,462 inbred lines with both genotypic and phenotypic data consisted of 14,613,169 SNPs from maize HapMap 3.2.1 (Bukowski et al. 2018) in B73 RefGen_v4 coordinates. These SNP loci were further filtered for quality to produce a high quality set of 12,184,805 SNPs that had minor allele frequency (MAF) ≥1% and predicted dosage r2 (DR2) ≥0.80 (Supplementary Data Set 1) for performing GWAS with the mixed linear model. In PLINK version 1.9 (Purcell et al. 2007) with a sliding window of 100 kb and step size of 25 SNPs, the complete set of 12,184,805 SNPs was LD pruned to construct 2 reduced marker sets (Supplementary Data Set 1): (1) 7,319,895 SNPs with pairwise r2 < 0.99 for performing GWAS with a multilocus mixed model (MLMM), and (2) 344,469 SNPs with pairwise r2 < 0.10 for estimation of population structure and relatedness.
Genome-wide association study
We conducted GWAS of the 9 tocochromanol phenotypes scored on the 1,462 lines with a previously described procedure (Wu et al. 2021). In brief, to correct for heteroscedasticity and non-normality of error terms, the Box-Cox power transformation procedure (Box and Cox 1964) was used to select an optimal value of convenient lambda for transforming the non-negative BLUE values of each phenotype (Supplementary Table 2). Given that several negative BLUE values were generated in the model fitting process, we added a constant that made all values positive and no less than 1E − 09 before applying the transformation (Supplementary Table 2). Each of 12,184,805 SNPs was tested for an association with transformed BLUE values from the 1,462 lines (Supplementary Table 3) using a mixed linear model (Yu et al. 2006) that employed the population parameters previously determined approximation (Zhang et al. 2010) in the R package GAPIT version 2018.08.18 (Lipka et al. 2012). In GAPIT, the reduced set of 344,469 SNPs was used to calculate the kinship matrix with the VanRaden method I (VanRaden 2008) and principal components (PCs). The optimal number of PCs to include in the mixed linear model fitted for each phenotype was determined by the Bayesian information criterion (BIC) (Schwarz 1978). The likelihood-ratio-based R2 statistic (R2LR) (Sun et al. 2010) was used to approximate the amount of phenotypic variation explained by a SNP. The “p.adjust” function in base R version 4.0.2 (R Core Team 2018) was used to apply the false discovery rate (FDR) multiple test correction procedure (Benjamini and Hochberg 1995) to the P-values of tested SNPs.
To control for large-effect loci, we used the MLMM approach of Segura et al. (2012) as implemented by Wu et al. (2021) to conduct a GWAS of each transformed tocochromanol phenotype with the reduced set of 7,319,895 SNPs that alleviated model constraints by removing perfectly correlated SNPs. In each model, we included the same kinship matrix and BIC-determined optimal number of PCs that had been used for GWAS with the mixed linear model.
Experimental design for transcriptomic profiling
In 2018, 1,023 of the 1,815 maize inbred lines from the Ames panel evaluated for grain tocochromanols plus 5 additional founders of the US maize NAM panel (Yu et al. 2008; McMullen et al. 2009) were grown as a single replicate at Iowa State University. This germplasm set was initially constructed by including 256 lines that met at least one of the following criteria: (1) extreme (high or low) for a grain metabolite phenotype in the 2015 field trial; (2) founder of the US NAM panel; or (3) available genome assembly. The additionally randomly selected 771 lines were included to increase genetic diversity and sample size. The 1,028 noncheck lines were partitioned and randomized into 24 augmented incomplete blocks based on pollination dates recorded in the 2015 and 2017 field trials and divided across 2 tiers. A B73 check plot was planted within each block to control for spatial variation across the field. Additionally, 2 local checks were planted at random positions in each block to account for temporal variation across fresh harvest dates that spanned more than a month. Within each block, the line that had flowered the latest in previous years was selected to serve as one of the 2 local checks; ties were broken by choosing the line with the highest sample call rate based on a filtered partially imputed GBS data set (Supplementary Data Set 2). Each selected local check was also planted in their adjacent later-flowering block, so that 2 local check lines were present in blocks 2–24. An additional early-flowering line (S 117) was identified as a local check and planted in block 1, ensuring that 2 local check lines were also planted in block 1. In addition, the 25 local checks (S 117, C38, A508, A641 Goodman-Buckler, C31, 807, LH202, 764, PHG71, PHB47, SD101, A680, B93, NC292, NC280, LH208, H100, NC252, NC314, LH51, CI 187-2, NC324, Mo11, NC334, and M37W) were planted in a separate third tier to account for field effects on these lines. Experimental units were 1-row plots of the same dimensions and plant numbers as used in the genetic mapping experiments. Of the ∼6 pollinated ears per plot, a single self-pollinated ear was hand-harvested at ∼23 days after pollination (DAP), followed by immediately freezing the dehusked ear in liquid nitrogen and keeping it covered in dry ice (and, for some samples, frozen at −80°C) until shelling. The 23 DAP time point was selected to capture maximal increase in tocochromanols and strong expression of known pathway genes (Diepenbrock et al. 2017). To control for temporal effects, a self-pollinated ear of a local check from the third tier was hand-harvested at ∼23 DAP on each day of fresh harvest, with all harvested ears identically processed with liquid nitrogen and dry ice prior to shelling. The midsection of each frozen ear was individually shelled on dry ice and its kernels stored at −80°C. In total, 1,012 noncheck and 107 check kernel samples were collected.
RNA isolation and 3′ mRNA sequencing
Eight to 10 frozen kernels per sample were ground using liquid nitrogen cooled grinding cups in an IKA Tube Mill Control (IKA-Werke, Staufen, Germany) and ∼100 mg of ground tissue was used for RNA isolation using a modified hot borate method (Wan and Wilkins 1994). RNA samples were DNase treated and checked for quality per Hershberger et al. (2022). RNA samples were randomized into 96-well plates and shipped overnight on dry ice to the Genomics Facility of the Cornell Institute of Biotechnology. Included in each plate submission were positive controls consisting of the same pool of B73 control RNA aliquoted into 4 wells in each plate, as well as 4 negative controls per plate consisting of water. Libraries were constructed using the Lexogen QuantSeq 3′ mRNA-Seq Library Kit FWD (Lexogen, Greenland, NH) and sequenced on an Illumina NextSeq 500 producing 85 nt single-end reads (Illumina, San Diego, CA) with each plate being split in half and each half being sequenced on a single lane to achieve desirable coverage.
Expression abundance determination
The 3′ QuantSeq reads were cleaned using 2 rounds of Cutadapt version 2.3 (Martin 2011) to trim Illumina adapters, the first 12 bases, and polyA tails. Reads were then aligned to the B73 RefGen_v4 reference genome (Jiao et al. 2017) using HISAT2 version 2.1.0 (Kim et al. 2019) with the following parameters: –min-intronlen 20, –max-intronlen 60,000, –dta-cufflinks, and –rna-strandness F. The resultant alignments were then sorted using SAMTools version 1.9 (Li et al. 2009). Counts were then generated using the htseq-count function within HTSeq version 0.11.2 (Anders et al. 2015) using the B73 version 4.59 annotation with the following parameters: –format=bam, –order=pos, –stranded=yes, –minaqual=10, –idattr=ID, –type=gene, and –mode=union. The DESeq2 rlog function (Love et al. 2014) was used to normalize the count data for the set of 1,171 RNA samples (1,119 kernel samples plus 52 positive controls). All genes with a normalized count of less than or equal to zero in all samples were removed from the final count matrix. Several stringent quality control measures based on sampling concerns (e.g. moldy kernels, etc.), alignment rate, between sample correlation value, genotype confirmation assessment, and heterozygosity level were implemented to filter out low quality samples as described in the Supplementary Methods and summarized in Supplementary Table 4, resulting in a final set of 741 high-quality samples that were used for subsequent analysis.
Expression data analysis
The expression data set consisting of 665 samples for 664 noncheck lines and 76 samples for 25 check lines was further stringently filtered for statistical outliers at the gene level following the approach of Hershberger et al. (2022) to ensure high quality data for statistical analysis. The filtering steps and metrics are summarized in Supplementary Table 4. With the filtered expression data set, we fit a mixed linear model that enabled the modeling of genetic and nongenetic effects as described in the Supplementary Methods. Of the 664 lines, we excluded 104 classified as sweet corn, popcorn, or having other endosperm mutations and an additional 15 lines not analyzed in GWAS. The final data set contained BLUE expression values of 22,136 genes across 545 lines.
To account for inferred confounders that influence expression variation, the PEER approach (Stegle et al. 2012) was separately applied to the 545 line × 22,136 gene matrix of BLUE expression values as previously described (Hershberger et al. 2022). Briefly, the optimal number of PEER hidden factors was determined to be 11 by finding the “elbow” in the curve of the diagnosis plot of the factor relevance. The contribution of 11 PEER hidden factors was subtracted to generate a residual data set of the BLUE expression values (hereafter, PEER values). Studentized deleted residuals (Neter et al. 1996) were used to identify and remove significant outliers (Bonferroni α = 0.05) from the set of PEER values (Supplementary Data Set 3).
Transcriptome-wide association study
We conducted TWAS on the 545 lines and 22,136 genes with a mixed linear model approach (Yu et al. 2006; Zhang et al. 2010). Briefly, a mixed linear model was fit for the combination of each tocochromanol phenotype (transformed BLUE values, response variable) and expressed gene (outlier-screened PEER values, explanatory variable) using the “GWAS” function and “P3D” option set to FALSE in the R package rrBLUP version 4.6 (Endelman 2011). To construct the SNP marker set for the 545 lines, 12,018,644 biallelic SNPs (DR2 ≥ 0.80; MAF ≥ 1%) were subsetted from the full set of 14,613,169 SNPs and pruned down to 328,892 SNPs with pairwise r2 < 0.10 with a 100-kb sliding window and 25 SNP step size in PLINK version 1.9 (Supplementary Data Set 4). The PCs and the kinship matrix were generated from the 328,892 SNPs as described above. The optimal models for all tocochromanol phenotypes included kinship and no PCs, as determined by the BIC (Schwarz 1978). The TWAS for the vte7 locus was conducted separately, given that reads for the vte7 locus were uniquely processed to account for tandemly duplicated genes (Supplementary Methods). The genes detected by TWAS were used for a GO term enrichment analysis in biological process (GO Ontology database DOI: 10.5281/zenodo.6399963 Released 2022 March 22) using the PANTHER overrepresentation test (Released 2022 February 02) (Mi et al. 2019) with Fisher’s exact test and significance declared at FDR P-value <0.05. Only GO biological processes that were significant and had >1-fold enrichment were considered.
Fisher’s combined test
The top 10% of the smallest P-value SNPs (1,218,480 SNPs) from GWAS with the mixed linear model were selected to perform FCT following the method of Kremling et al. (2019). The sampling of SNPs was focused on the top 10% to reduce the computational burden, given that the bottom 90% of SNPs from GWAS were not expected to produce novel associations in the FCT. In brief, the GWAS P-value of each top 10% SNP was assigned to its nearest gene based on the B73 RefGen_v4 assembly and B73 v4.59 annotation and then paired with the TWAS P-value for that gene. For genes not tested in TWAS, their TWAS P-values were set to 1 before combining with GWAS P-values. For each gene, FCT was conducted with the “sumlog” function implemented in the R package metap version 1.1 (Dewey 2019).
Candidate gene identification
Given that GWAS, TWAS, and FCT differ in their statistical power and type of independent variables, we did not directly compare P-value thresholds across methods but instead used the rankings of P-values following that of Kremling et al. (2019). The top 0.02% of SNPs were selected according to their P-value from GWAS results for each phenotype, with selection of the percentage threshold guided by the number of JL-QTL detected for each of the 9 tocochromanol grain phenotypes (12-21 JL-QTL per phenotype) in the US maize NAM panel (Diepenbrock et al. 2017). Considering the rapid LD decay in the Ames panel (Romay et al. 2013), candidate genes were identified within 100 kb of the peak SNP for each locus following the method of Wu et al. (2021). The top 0.5% of genes according to their P-value were selected from TWAS and FCT results for each phenotype, resulting in a total number of unique genes identified across phenotypes by each method comparable to that of GWAS.
The identification of candidate genes was assisted by a list of 126 a priori candidate genes involved in the accumulation of grain tocochromanol levels (Supplementary Table 5) that was assembled following the bioinformatic method of Lipka et al. (2013). The physical positions of 50 unique JL-QTL common support intervals (CSIs) and GWAS markers associated with the 9 tocochromanol grain phenotypes in the US NAM panel (Diepenbrock et al. 2017) were uplifted via Vmatch version 2.3.0 (Kurtz 2010) to B73 RefGen_v4 coordinates (Supplementary Tables 6 and 7) as described in Wu et al. (2021). A BLASTP with default parameters was conducted to identify the top hits of undescribed candidate causal genes (Supplementary Table 8) in Arabidopsis and rice as previously described (Wu et al. 2021).
eQTL mapping
We performed expression QTL (eQTL) mapping of the identified candidate causal genes. To conduct eQTL mapping, the 12,018,644 SNPs subsetted in the TWAS approach were individually tested for association with PEER values of each candidate causal gene using a mixed linear model implemented in GAPIT version 2018.08.18 (Lipka et al. 2012) in R version 4.0.2 (R Core Team 2018). The calculated PCs and kinship matrix used in TWAS were used in eQTL mapping, with the optimal number of PCs determined by BIC (Schwarz 1978). To have a stringent control of the Type I error rate in the presence of complex LD patterns and strong association signals, we accounted for multiple testing with a 5% Bonferroni adjusted significance threshold (P-value ≤4.16E − 09), with peak SNPs of loci identified as described in Wu et al. (2021).
Annotation of variants
SNP effect analysis (SnpEff; Cingolani et al. 2012) was conducted following the approach of Diepenbrock et al. (2021) to predict the effects of GWAS-associated SNPs located within candidate causal genes. To quantitatively assess whether variant sites are evolutionarily conserved, genomic evolutionary rate profiling (GERP; Davydov et al. 2010) scores available from 2 earlier studies (Kistler et al. 2018; Ramstein et al. 2020) were extracted for the same SNP sites within candidate causal genes.
eQTL and GWAS CAusal Variants Identification in Associated Regions
To quantify the probability that a variant was responsible for both GWAS and cis-eQTL signals, we used the eQTL and GWAS CAusal Variants Identification in Associated Regions (eCAVIAR) method of Hormozdiari et al. (2016) that accounts for LD patterns and allelic heterogeneity when implementing a probabilistic model for integrating GWAS and cis-eQTL results. The eCAVIAR approach was applied to candidate causal gene loci detected via GWAS that had a significant cis-eQTL signal. For each gene–phenotype pair, the t-values of all significant GWAS and eQTL SNPs within 100 or 250 kb of the candidate causal gene and pairwise LD matrices calculated from these SNPs in PLINK 1.9 (Purcell et al. 2007) were used as the input data sets for the eCAVIAR software. The ±250-kb window was only used for 2 genes (arodeH2 Zm00001d014734 and vte1) that had a peak eQTL signal >100 kb from its respective gene. Given the potential of allelic heterogeneity, the maximum number of causal SNPs at a locus was set to 3. A stringent colocalization posterior probability (CLPP) cutoff threshold of ≥0.01 was used to identify SNPs that were potentially causal in both the GWAS and eQTL studies.
Results
Phenotypic variation
We assessed the extent of quantitative variation for tocochromanol concentrations in physiologically mature grain samples harvested from 2 outgrowths of the maize Ames panel. The measurement of 6 tocochromanol compounds by HPLC showed that γT (∼55%) and γT3 (∼23%) collectively accounted for nearly 80% of ΣTT3, whereas the α and δ isoforms for both tocopherols and tocotrienols individually represented approximately 1% (δT3) to 10% (αT3) of ΣTT3 (Table 1). The tocochromanol compound with the highest vitamin E activity, αT, had the third lowest mean concentration (5.83 μg g−1 dry seed) and accounted for only ∼8% of ΣTT3. Within a compound class, significant pairwise correlations between BLUE values (α = 0.05) were strongest between the δ and γ isoforms for tocopherols (r = 0.67) and tocotrienols (r = 0.62), whereas the strongest correlation between compound classes was observed for αT with αT3 (r = 0.45). However, only weak correlations (−0.15 to 0.19) were found between all other pairs of compounds despite having a shared biosynthetic pathway (Supplementary Fig. 1). As inferred from the high estimates of heritability on a line-mean basis (0.77 to 0.94, Table 1), the majority of variation for each of the 6 tocochromanol compounds and 3 sum phenotypes was attributable to genetic variation in the Ames panel (Table 1 and Supplementary Fig. 2).
Means, ranges, and SDs of untransformed BLUE values (in μg g−1) for 9 tocochromanol grain phenotypes evaluated in the Ames panel and estimated heritabilities on a line-mean basis and their SEs across 2 years.
| Phenotypea | Number of lines | BLUEs | Heritabilities | |||
|---|---|---|---|---|---|---|
| Mean | Range | Std. Dev. | Estimate | Std. Err. | ||
| αT | 1,452 | 5.83 | –1.79 to 41.36 | 4.59 | 0.87 | 0.006 |
| δT | 1,456 | 1.74 | –0.33 to 14.32 | 1.62 | 0.85 | 0.007 |
| γT | 1,458 | 42.19 | –1.32 to 158.91 | 21.34 | 0.86 | 0.006 |
| ΣT | 1,460 | 49.95 | 1.79 to 174.84 | 22.65 | 0.85 | 0.007 |
| αT3 | 1,456 | 7.87 | 0.89 to 23.39 | 3.21 | 0.77 | 0.010 |
| δT3 | 1,454 | 0.93 | 0.01 to 17.05 | 0.97 | 0.94 | 0.003 |
| γT3 | 1,458 | 17.60 | –1.79 to 90.39 | 11.71 | 0.93 | 0.003 |
| ΣT3 | 1,458 | 26.55 | 2.62 to 111.01 | 13.32 | 0.91 | 0.004 |
| ΣTT3 | 1,460 | 77.04 | 18.13 to 205.36 | 28.08 | 0.87 | 0.006 |
The 3 sum phenotypes were calculated as follows: ΣΤ = αΤ + δΤ + γΤ; ΣΤ3 = αΤ3 + δΤ3 + γΤ3; ΣΤΤ3 = ΣΤ + ΣΤ3.
Genetic analysis of tocochromanol levels in grain
We integrated GWAS and TWAS results through FCT, an ensemble approach shown to have enhanced statistical power over either GWAS or TWAS alone for the detection of causal genes associated with natural variation for tocochromanol grain phenotypes in maize (Kremling et al. 2019). The findings from FCT (top 0.5%), GWAS (top 0.02%), and TWAS (top 0.5%) for each phenotype were integrated with the genetic mapping results of the same grain phenotypes in the US NAM panel (Table 2), with the intent to further resolve loci previously found in the NAM panel to the level of causal genes (Fig. 2 and Supplementary Fig. 3). Within each analysis, a total of 720 unique genes were identified from 121 loci in GWAS, 676 in TWAS, and 918 in FCT across the 9 tocochromanol grain phenotypes (Supplementary Tables 9–12). Of these, 330 (GWAS), 299 (TWAS), and 646 (FCT) genes were located within NAM JL-QTL CSIs of the 9 phenotypes (Diepenbrock et al. 2017). When conducting a GO term enrichment analysis of the 676 genes identified in TWAS, we did not find any of the GO biological processes to be significant at 5% FDR and >1-fold enriched.
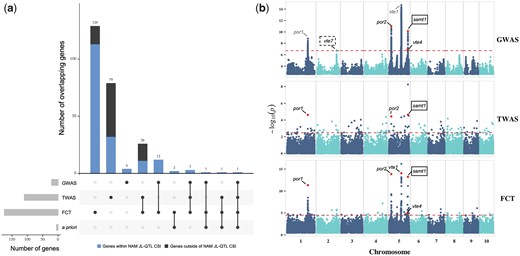
GWAS, TWAS, and FCT results for δT. a) Upset plot showing the number of overlapping genes between GWAS, TWAS, FCT, and a priori pathway genes involved in the biosynthesis of chlorophylls and tocochromanols (Supplementary Table 5). The number of genes located within the US NAM joint linkage-quantitative trait loci (JL-QTL) common support interval (CSI) for δT is highlighted in blue in the bar plots. b) Manhattan plots of GWAS, TWAS, and FCT results. Each point represents a SNP or gene with its −log10P-value (y-axis) from GWAS, TWAS, and FCT plotted as a function of physical position (Mb, B73 RefGen_v4) across the 10 chromosomes of maize (x-axis). Red horizontal dashed lines indicate the thresholds of top 0.02%, top 0.5%, and top 0.5% for GWAS, TWAS, and FCT, respectively. Candidate causal genes (Table 2) that are within 100 kb of a top 0.02% GWAS peak SNP or ranked in the top 0.5% in TWAS or FCT are highlighted with red dots and labeled in black in the Manhattan plots. Candidate causal genes that are within 1 Mb of a top 0.02% GWAS peak SNP are labeled in gray. Novel associations are marked with a solid line, black rectangle. Novel associations that only passed the 5% false discovery rate in GWAS are marked with a dashed line, black rectangle.
Genetic mapping results of the 9 tocochromanol grain phenotypes in the Ames panel.
| Gene ID | Locusa | Chr | Gene start | Gene end | GWASb | TWASc | FCTd | NAM JL-QTL CSI IDe |
|---|---|---|---|---|---|---|---|---|
| Zm00001d032576 | por1 | 1 | 231,120,510 | 231,123,615 | ΣΤf | δΤ, γΤ, ΣΤ, ΣΤΤ3 | δΤ, γΤ, ΣΤ, ΣΤΤ3 | 5 |
| Zm00001d001896 | vte5 | 2 | 2,509,567 | 2,511,414 | ΣΤΤ3 | – | – | – |
| Zm00001d006778 | vte7g | 2 | 216,443,683 | 216,448,352 | δΤ | – | – | 12 |
| Zm00001d006779 | 216,461,133 | 216,468,803 | ||||||
| Zm00001d013937 | por2 | 5 | 25,431,430 | 25,434,346 | δΤ, γΤ, ΣΤ, ΣΤΤ3 | αΤ, δΤ, γΤ, ΣΤ, ΣΤΤ3 | αΤ, δΤ, γΤ, ΣΤ, ΣΤΤ3 | 24 |
| Zm00001d014734 | arodeH2 | 5 | 61,099,110 | 61,100,192 | γΤ3, ΣΤ3 | – | – | 25 |
| Zm00001d014737 | arodeH2 | 5 | 61,117,986 | 61,119,432 | γΤ3, ΣΤ3 | – | δΤ3, γΤ3, ΣΤ3 | 25 |
| Zm00001d015356 | hppd1 | 5 | 86,084,655 | 86,086,755 | γΤ3, ΣΤ3 | – | δΤ3, γΤ3, ΣΤ3, ΣΤΤ3 | 26 |
| Zm00001d015985 | vte1 | 5 | 136,805,708 | 136,822,194 | δΤ3 | – | δΤ, δΤ3 | 26 |
| Zm00001d017746 | vte4 | 5 | 205,825,586 | 205,829,216 | αΤ, αΤ3, δΤ, γΤ, γΤ3, ΣΤΤ3 | αΤ, αΤ3, γΤ3 | αΤ, αΤ3, δΤ, γΤ, γΤ3 | 28 |
| Zm00001d017937 | samt1 | 5 | 210,385,310 | 210,401,948 | αΤ3, δΤ | δΤ | δΤ, δΤ3 | 29 |
| Zm00001d038170 | dxs1 | 6 | 150,418,144 | 150,422,431 | – | γΤ3 | – | 32 |
| Zm00001d019060 | dxs2 | 7 | 14,494,700 | 14,497,925 | – | δΤ3, γΤ3, ΣΤ3 | – | 35 |
| Zm00001d046558 | hggt1 | 9 | 95,895,575 | 95,899,061 | αΤ3, δΤ3, γΤ3 | δΤ3, γΤ3, ΣΤ3 | αΤ3, δΤ3, γΤ3, ΣΤ3, ΣΤΤ3 | 45 |
The name and symbol of a maize gene locus are represented with lower-case, italic characters, to be consistent with maize genetics nomenclature.
Genome-wide association study.
Transcriptome-wide association study.
Fisher’s combined test.
Common support interval (CSI) from joint linkage-quantitative trait loci (JL-QTL) results (Supplementary Table 6) of 9 tocochromanol grain phenotypes analyzed in the maize NAM panel (Diepenbrock et al. 2017) that contain the open reading frame of the gene.
The 3 sum phenotypes were calculated as follows: ΣΤ = αΤ + δΤ + γΤ; ΣΤ3 = αΤ3 + δΤ3 + γΤ3; ΣΤΤ3 = ΣΤ + ΣΤ3.
The vte7 locus could not be tested in FCT due to the lack of nonparalogous SNPs flanking the duplicated alpha/beta hydrolase genes (Zm00001d006778 and Zm00001d006779).
Of the 13 gene loci identified to associate with grain tocochromanols in the US NAM panel by Diepenbrock et al. (2017), 5 (por1, por2, vte4, hggt1, and hppd1), which tended to be large-effect loci in the NAM panel, were detected by FCT for one or more phenotypes in the Ames panel (Table 2). Of the 5 genes, por1, por2, vte4, and hggt1 were also identified by both GWAS and TWAS, whereas hppd1 was only detected by GWAS. In contrast, dxs2, another of the 13 genes identified by Diepenbrock et al. (2017), was only detected by TWAS. Two copies of arodeH2 (Zm00001d014734 and Zm00001d014737) were within 100 kb of GWAS peak SNPs for γΤ3 and ΣΤ3, with Zm00001d014734 having been previously implicated by Diepenbrock et al. (2017) as a gene with small allelic effects involved in the genetic control of αΤ3 and ΣΤ3. However, in the Ames panel, Zm00001d014737 was detected by both FCT and GWAS, whereas Zm00001d014734 was only detected by GWAS. In total, we reidentified 7 of the 13 genes from Diepenbrock et al. (2017) and implicated a second arodeH2 copy for controlling variation in tocotrienols.
The detection of these 8 genes, one of which a new association, illustrated the gene-level resolution of our integrated genetic mapping approach; thus, it was applied to better resolve NAM JL-QTL CSIs and detect loci novel in the Ames panel. In total, 4 NAM JL-QTL CSIs were more finely dissected, resulting in novel associations with 3 loci (samt1, vte7, and dxs1) and more precise mapping of a fourth (vte1) not fully resolved in the US NAM panel. A gene encoding a SAM transporter (samt1, Zm00001d017937) was detected by FCT, GWAS, and TWAS. Zm00001d017937 encodes a protein with 77% identity to Arabidopsis S-adenosylmethionine transporter 1 (SAMT1, AT4G39460) (Supplementary Table 8), which transports SAM, a tocochromanol cosubstrate for the VTE3 and VTE4 methyltransferases, through plastid envelopes and negatively impacts leaf tocopherol levels when silenced (N. benthamiana) or knocked out (Arabidopsis) (Bouvier et al. 2006; Palmieri et al. 2006). When considering the top 0.02% of SNPs most associated with δT in GWAS, the vte7 locus consisting of tandemly duplicated genes (Zm00001d006778 and Zm00001d006779) was found to be ∼64 kb from a single associated SNP (Fig. 2). This same SNP served as the peak of a δT-associated locus consisting of 45 significant SNPs at an FDR of 5% (Supplementary Table 12), providing stronger evidence for detection of vte7 in the Ames panel compared to the NAM panel. Two additional a priori pathway genes, dxs1 (TWAS) and vte1 (FCT and GWAS), were associated with one or more tocochromanol grain phenotypes (Table 2). In addition to more finely dissecting NAM JL-QTL CSIs, we detected a significant association of vte5 with ΣΤΤ3 by GWAS alone, the first report of such an association for this locus with any tocochromanol grain trait in maize. Therefore, the Ames panel not only offered gene-level resolution for existing NAM JL-QTL CSIs, but also enabled the identification of loci not detected in the NAM panel.
We also conducted a GWAS with the MLMM approach, allowing us to better resolve association signals underpinned by large-effect loci. Of the 11 gene loci detected by GWAS with the mixed linear model (Table 2), 8 genes (por2, vte1, both arodeH2 copies, hppd1, vte4, samt1, and hggt1) were located within 100 kb of at least 1 MLMM-selected SNP for one or more of the 9 tocochromanol phenotypes, with models explaining 3–37% of the phenotypic variation (Supplementary Table 13). Although at slightly lower mapping resolution, the por1 gene was located ∼162 kb from one of the multiple MLMM-selected SNPs for tocopherol phenotypes. Even though vte5 and vte7 were detected in GWAS with the mixed linear model, neither of them was detected with the MLMM approach. Of the MLMM-selected SNPs within 100 kb of vte4, 2–4 SNPs each were selected for αT, αT3, and γT, whereas only a single SNP was selected for each of δT and γT3. Comparably, 2–3 SNPs from a ∼1.2-Mb genomic region that included hggt1 were selected by the MLMM for δT3, γT3, and ΣT3; however, only 2 of the MLMM-selected SNPs were located within 100 kb of hggt1. As has been previously hypothesized for vte4 in the Goodman–Buckler panel (Lipka et al. 2013), the selection of multiple independent SNPs by the MLMM implies that multiple causal variants (i.e. allelic heterogeneity) exist at the vte4 and hggt1 loci in the Ames panel.
Functional annotation of associated SNPs
We used 2 approaches to identify potential causal variants that change an encoded amino acid in associated genes. The SnpEff tool predicted the functional effects of the 320 GWAS-associated SNPs residing within candidate causal genes, resulting in 15 total missense variant annotations for por1, por2, vte1, vte4, samt1, and hggt1 that were predicted to have moderate effects (Supplementary Table 14). Of the 15 missense variants, 9 had an available GERP score from one or both of 2 earlier studies (Kistler et al. 2018; Ramstein et al. 2020). Each of the 9 sites had at least 1 positive GERP score (>0), implying as expected that these sites within coding regions are evolutionarily constrained (Davydov et al. 2010; Rodgers-Melnick et al. 2015). Collectively, 6 missense variants within por1, vte1, samt1, and hggt1 had the highest positive GERP scores (>2), suggesting that they are more deleterious (Yang et al. 2017; Lozano et al. 2021). Given that vte1 was not detected by TWAS and had 3 of the 6 putatively more deleterious variants, these amino acid changes are of potentially high functional importance as they may impact the activity of tocopherol cyclase. However, allozymes of VTE1 would need to be experimentally evaluated for enzyme activity levels to determine if any of these or other variants are compensatory mutations.
eQTL mapping of candidate causal loci
To gain insights into the regulatory patterns of the loci identified through GWAS, TWAS, and FCT in the Ames panel (Table 2), eQTL mapping was conducted for each of the 13 identified candidate causal gene loci (Fig. 3 and Supplementary Fig. 4). Of the 13 loci, cis-eQTL (peak SNP within 1 Mb of gene) were identified for all but 1 gene (arodeH2 Zm00001d014737), whereas a total of 5 trans-eQTL were identified for 4 genes (vte5, por2, dxs1, and dxs2) (Supplementary Table 15). The peak SNPs for cis-eQTL were within 100 kb of their respective gene, with the exceptions of arodeH2 Zm00001d014734 (227 kb), dxs2 (808 kb), and vte1 (220 kb) (Supplementary Table 15). In general, cis-eQTL had smaller P-values than trans-eQTL, except in the case of dxs2 where its trans-eQTL had a smaller P-value than its cis-eQTL. This dxs2 trans-eQTL was located on chromosome 6, having a peak SNP ∼1.5 kb from phytoene synthase1 (psy1, Zm00001d036345), which encodes the first and committed step of carotenoid biosynthesis (Hirschberg 2001).
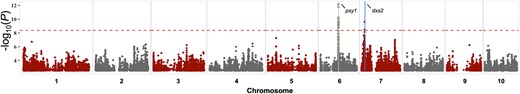
Manhattan plot of eQTL mapping results of dxs2. Each point represents a SNP with its −log10P-value (y-axis) from a mixed linear model analysis plotted as a function of physical position (Mb, B73 RefGen_v4) across the 10 chromosomes of maize (x-axis). The red horizontal dashed line indicates the significant threshold after Bonferroni correction (α = 0.05). The genomic position of dxs2 is demarcated with a blue vertical line on chromosome 7. A plausible regulating gene, phytoene synthase1 (psy1), within 100 kb of the trans-eQTL peak SNP is indicated by a green vertical line on chromosome 6.
Colocalization of GWAS and eQTL signals
Through the integration of GWAS and eQTL mapping results via a probabilistic approach (eCAVIAR; Hormozdiari et al. 2016), we tested whether a variant was responsible for both GWAS and cis-eQTL signals at each GWAS-identified candidate causal gene locus that had a significant cis-eQTL signal: arodeH2 Zm00001d014734, hggt1, hppd1, por1, por2, samt1, vte1, vte4, vte5, and vte7. Of the analyzed 23 gene–phenotype pairs, 18 pairs had 1–6 SNPs with a colocalization posterior probability (CLPP) value—probability that a variant is causal for both a GWAS and eQTL signal—that exceeded a stringent cutoff threshold of ≥0.01 (Supplementary Fig. 5 and Supplementary Table 16). In all, these analyses resulted in the selection of 24 unique SNPs within (por1 and hppd1) or flanking (arodeH2 Zm00001d014734, hggt1, por2, samt1, vte4, and vte5) 8 of the 10 investigated genes. Only one of the 3 SNPs within a candidate causal gene was an annotated missense variant (Arg -> Gly; GERP ≥ 2), having been selected from SNPs within por1 for total tocopherols (Supplementary Table 14). The other 21 selected SNPs were a median distance of 9.3 kb from their respective candidate causal genes. With the strongest evidence for colocalization, a SNP (5_25434949) located 603 bp from por2 had the highest CLPP values (0.12–0.17) for γT, ΣT, and ΣTT3, which was concordant given that this same SNP was the peak marker for GWAS (mixed linear model: γT, ΣT, and ΣTT3) and cis-eQTL signals at por2 (Fig. 4 and Supplementary Tables 9 and 15). We observed additional statistical support for allelic heterogeneity (i.e. independent SNPs with CLPP values ≥0.01) at hggt1 for δT3 (Supplementary Fig. 5), but not at vte4 which had the same single SNP (5_205853870, ∼25 kb from vte4) selected for αT, αT3, δT, γT, and γT3 (CLPP values: 0.06–0.14). The only other GWAS detected loci that had significant cis-eQTL signals were vte1 and vte7, but the CLPP values of SNPs for these 2 loci were <0.01. Given this finding and that these 2 loci were not detected in TWAS, the causal variants at vte1 and vte7 are potentially different for the genetic control of grain tocochromanol and gene expression variation.
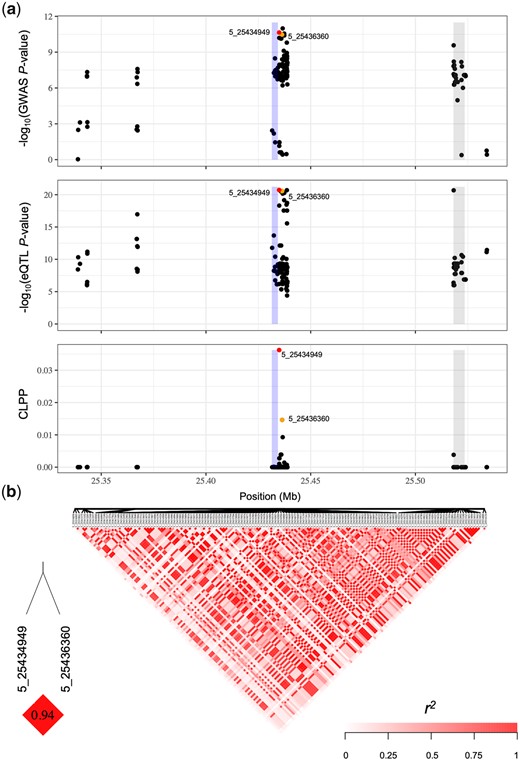
GWAS, eQTL, and eCAVIAR results at por2 for δT. a) Three local Manhattan plots (±100 kb) showing the GWAS, eQTL, and eCAVIAR results at por2 for δT. Each point represents a SNP with its −log10P-value (y-axis) from a mixed linear model analysis in GWAS or eQTL, or the CLPP value from eCAVIAR, plotted as a function of physical position (Mb, B73 RefGen_v4) on chromosome 5 (x-axis). The blue rectangle represents the physical position of por2. The gray rectangle represents the physical position of a second gene (Zm00001d013940, nucleolar complex protein 2 homolog) within the interval. The red dot represents the SNP with the highest CLPP value, and the orange dot represents the other SNP with a CLPP value passing the ≥0.01 threshold. b) Pairwise LD (r2) of all SNPs included in (a), with the LD between SNPs with CLPP values ≥0.01 indicated in the bottom left.
Discussion
Through combining complementary quantitative genetic approaches that span levels of biological organization, we conducted a comprehensive investigation in the maize Ames panel of nearly 1,500 lines to elucidate the genetic basis of natural variation for tocochromanol levels in grain. Imputing the Ames panel with ∼12 million SNP markers, generating transcript abundances of ∼22,000 genes at a biologically informative stage of kernel development, and HPLC profiling of more than 3,500 mature grain samples empowered implementation of GWAS, TWAS, FCT, and eQTL approaches. This enabled identification of 13 candidate causal gene loci with encoded functions responsible for varying the content and composition of tocochromanols in grain. These 13 genes include a SAM transporter (samt1) and genes involved in synthesis of the tails of tocochromanols (por1, por2, vte5, vte7, dxs1, and dxs2), the aromatic head group (2 arodeH2 copies and hppd1), and the core tocochromanol pathway (vte1, vte4, and hggt1). Of the 13 identified genes, 8 were detected by 2 or more of the 3 (GWAS, TWAS, and FCT) genetic mapping approaches (Table 2). Implicating the importance of regulatory variation, 7 of the 13 genes were detected by TWAS of which 2, dxs1 and dxs2, were only detected by TWAS. Taken together, the integrated GWAS and TWAS method enhanced our efforts to genetically dissect tocochromanol grain phenotypes at gene-level resolution in the Ames panel.
Indicative of the high resolution and statistical power of our multiomic approach applied to the Ames panel that contains high allelic diversity and rapid LD decay (Romay et al. 2013), 6 of the 13 genes (samt1, arodeH2 Zm00001d014737, dxs1, vte1, vte5, and vte7) were not identified in the maize NAM panel (Diepenbrock et al. 2017). Notably, all but 1 of the 6 genes (vte1) had not been previously associated with maize grain tocochromanols (Li et al. 2012; Lipka et al. 2013; Diepenbrock et al. 2017; Wang et al. 2018). The association signal at vte5 was novel to the Ames panel, likely due to a limitation of the US NAM panel in its sampling of allelic diversity from only 26 diverse founder lines. In the US NAM panel, samt1, dxs1, and vte7 were each located within an unresolved NAM JL-QTL CSI, but arodeH2 Zm00001d014737, which was detected by GWAS and FCT, was in a NAM JL-QTL CSI that was instead associated with arodeH2 Zm00001d014734 (Diepenbrock et al. 2017). vte1 was present in a NAM JL-QTL CSI that also included hppd1, but unlike hppd1 the vte1 locus could not be conclusively identified due to the recombination-suppressed pericentromeric region in which it resides, which limited mapping precision (Diepenbrock et al. 2017). The Ames panel, however, provided the increased resolution necessary to resolve both hppd1 and vte1 at the gene level. Six other smaller effect loci identified for grain tocochromanols in the US NAM panel (sds, vte3, snare, ltp, phd, and fbn) were not identified in the Ames panel, suggesting that though it has superior physical resolution it has lower statistical power than a NAM design for identifying small effect QTL.
This study identified the first metabolite transporter associated with grain tocochromanols, Zm00001d017937, which encodes the maize ortholog of Arabidopsis SAMT1, which transports SAM into plastids (Bouvier et al. 2006; Palmieri et al. 2006). Maize samt1 was associated with δΤ, δΤ3, and αΤ3 (Table 2), consistent with the 2 plastid-localized tocopherol methyltransferases (VTE3 and VTE4) being dependent on it for import of their cosubstrate, SAM, from the cytosol (Bouvier et al. 2005; DellaPenna 2005). Knockout and silencing of SAMT1 in Arabidopsis and N. benthamiana, respectively, resulted in leaves with lower levels of αT and total chlorophyll (which also requires SAM for its synthesis) and increased γT content (Bouvier et al. 2006), again consistent with reduced import of SAM limiting conversion of γT to αT (and δΤ to βT) by VTE4 (Bouvier et al. 2006). Given the strong negative relationship between samt1 expression and δΤ concentration revealed by TWAS (Supplementary Table 17), we hypothesize that weak expression of samt1 results in higher accumulation of δΤ by lowering the SAM-dependent activities of VTE4 and/or VTE3 (Fig. 1).
The identification of por1, por2, vte7, and vte5 loci, which predominantly impacted tocopherols, is consistent with them all participating in the generation of PDP for tocopherol synthesis (Valentin et al. 2006; Diepenbrock et al. 2017; Albert et al. 2022). The 2 por loci underlie the 2 largest effect JL-QTL for grain ΣΤ in the maize NAM panel (Diepenbrock et al. 2017) and encode a key enzyme for a highly regulated activity in chlorophyll biosynthesis. Diepenbrock et al. (2017) found por1 and por2 to be correlated expression and effect QTL (ceeQTL) for ΣT; i.e. that the JL allelic effect estimates of these QTL for that trait were significantly associated with expression levels of the respective gene at multiple kernel developmental time points. In concordance with these findings, por1 and por2 were also the 2 most strongly associated genes with ΣΤ via TWAS and FCT in this study. In the Ames panel, an association signal for δΤ localized to vte7 both by GWAS (5% FDR) and more weakly by TWAS (0.6% of most significant genes). Finally, vte5, one of 2 kinases needed to generate PDP from phytol (Valentin et al. 2006; Vom Dorp et al. 2015), was associated in GWAS with total tocochromanols (ΣΤΤ3) in maize. In Arabidopsis, VTE5 was one of the strongest associations with seed ΣΤ (Albert et al. 2022). The association of por1, por2, vte7, and vte5 with maize grain tocopherol traits in the present study, and VTE7 and VTE5 with seed tocopherol traits in Arabidopsis further strengthens the connection between tocopherol and chlorophyll biosynthesis in seed and suggests it is a major control point for seed tocochromanol variation in both monocots and dicots.
The dxs1 and dxs2 genes were only associated in TWAS with tocotrienol, but not tocopherol, traits. Both genes encode the first and committed step of the methylerythritol 4-phosphate (MEP) pathway, suggesting they are key control points in the provision of IPP used to generate GGDP for tocotrienol synthesis. In addition to our finding of an association of dxs2 transcript abundances with tocotrienol levels, Diepenbrock et al. (2017) found dxs2 to be a ceeQTL for tocotrienol traits (δΤ3, γΤ3, and ΣT3). Our eQTL mapping of dxs2 expression variation identified a major trans-eQTL on chromosome 6 (Supplementary Table 14) that mapped to phytoene synthase 1 (psy1, Zm00001d036345). psy1 encodes the first and committed step in the biosynthesis of carotenoids (Hirschberg 2001). In Arabidopsis, flux into the carotenoid pathway is controlled by PSY activity via feedback regulation of DXS protein levels (Rodríguez-Villalón et al. 2009). Thus, it is possible that psy1 indirectly affects tocotrienol levels in maize grain, even though we did not find psy1 to be significantly associated with tocotrienols.
Like dxs1 and dxs2, the 3 identified genes involved in aromatic head group biosynthesis were specific for tocotrienol traits and include 2 copies of arodeH2 (arodeH2 Zm00001d014734, and arodeH2 Zm00001d014737) and hppd1. ArodeH catalyzes the oxidative decarboxylation of arogenate to tyrosine, which is then transaminated to p-hydroxyphenylpyruvic acid (HPP), the substrate for HPPD. The 2 arodeH2 genes are separated by 18 kb and their GWAS associations were with the same peak SNP (5_61159296), located ∼40 kb from Zm00001d014737 and ∼60 kb from Zm00001d014734. Only Zm00001d014737 passed the FCT threshold (<0.3% vs >1.2% for Zm00001d014734), primarily because of its closer proximity to GWAS SNPs with lower P-values. A single cis-eQTL was declared for Zm00001d014734 (Supplementary Table 15), while Zm00001d014737 lacked significant cis- or trans-eQTL. The current evidence from studies of both the US NAM and Ames panels cannot exclude the possibility that both arodeH2 genes are involved in head group biosynthesis.
The enzyme encoded by hppd1 produces HGA, the aromatic headgroup used for synthesis of tocopherols and tocotrienols. In concordance with the findings of Diepenbrock et al. (2017), we found hppd1 to be strongly associated with tocotrienols, but its weak associations with tocopherols in the US NAM panel were not replicated in the Ames panel, likely because the allelic effect sizes for tocopherol traits were below significance in the Ames panel. In agreement with Diepenbrock et al. (2017) who found hppd1 was not a ceeQTL, hppd1 was also not detected by TWAS in the Ames panel at a 0.5% threshold.
The 3 identified genes encoding core activities in the tocochromanol pathway (vte1, vte4, and hggt1) impacted tocochromanol phenotypes in a manner consistent with their enzymatic activities (Shintani and DellaPenna 1998; Cahoon et al. 2003; Hunter and Cahoon 2007; DellaPenna and Mène-Saffrané 2011). VTE4 methylates γ- and δ-tocopherols to produce α- and β-tocopherols (Shintani and DellaPenna 1998; DellaPenna and Mène-Saffrané 2011). vte4 was strongly associated with γ and α isoforms in the Ames panel, consistent with prior GWAS reports (Li et al. 2012; Lipka et al. 2013; Diepenbrock et al. 2017; Wang et al. 2018; Baseggio et al. 2019), and more weakly with δΤ (GWAS and FCT) and ΣΤΤ3 (GWAS). Similarly, hggt1 encodes the committed step of tocotrienol biosynthesis and was significantly associated with all tocotrienol traits, reconfirming hggt1 as the key genetic controller of tocotrienol variation (Lipka et al. 2013; Diepenbrock et al. 2017; Baseggio et al. 2019). However, the relatively weaker associations of hggt1 with tocopherols detected in the US NAM panel were not reidentified in the Ames panel (Diepenbrock et al. 2017). Both vte4 and hggt1 were designated as ceeQTL by Diepenbrock et al. (2017) and were the highest ranked genes detected in TWAS for αT, αT3, and ΣT3 in the Ames panel, highlighting the importance of regulatory variation in the core tocochromanol pathway. VTE1 converts MPBQ and MGGBQ to δΤ and δΤ3, respectively, and we identified associations of vte1 with δΤ and δΤ3 at higher resolution (i.e. significant variants closer to the gene) than in other diversity panels (Lipka et al. 2013; Baseggio et al. 2019) (Table 2 and Supplementary Table 9).
By conducting a statistical analysis that uses a probabilistic method to combine GWAS and eQTL results, we identified a set of 24 unique SNPs at 8 candidate causal gene loci that contributed to both GWAS and cis-eQTL signals, providing support for an eQTL-mediated mechanism in which variants affect tocochromanol levels. Twenty-one of these selected SNPs were located outside (up to 136.5 kb) of the 8 genes, with 18 of them upstream of the 5′ end of their respective gene. Even though the selected SNPs are likely not causal themselves and in strong LD with causal variants that may include copy-number variants, these results imply that the underlying causal variants for the colocalized signals predominantly resided in the vicinity of promoters and upstream cis-regulatory elements. Although cis-eQTL were almost always the largest effect QTL detected for expression variation of candidate casual genes, our study was limited by statistical power and the multiple testing burden, thus not allowing a more complete genetic dissection of trans-eQTL (Albert et al. 2018). However, cis effects tend to be more stable than trans effects across environments, thus cis-acting causal variants have the potential to be more transferable across populations when incorporated at the haplotype level in genomic prediction models (Giri et al. 2021).
Conclusions
We identified 13 candidate causal gene loci responsible for controlling natural variation of 9 tocochromanol grain phenotypes with encoded activities related to metabolism and metabolite transport. All 13 loci are highly probable to be causal as most have been shown by mutagenesis and transgenic modifications to affect tocochromanol levels in maize and/or other model plant systems. The 5 novel associations identified for samt1, arodeH2 Zm00001d014737, dxs1, vte5, and vte7 together with finer delineation of vte1, illustrates the tremendous statistical power and mapping resolution provided by the Ames panel when combining GWAS and TWAS results to study the genetic basis of tocochromanol variation in maize grain. When integrated with the findings of Diepenbrock et al. (2017) and Wang et al. (2018), there is now a more complete catalog of the key gene targets that connect the tocochromanol and chlorophyll pathways for breeding and engineering of vitamin E and antioxidant levels in maize and other grain crops. The joint statistical analysis of eQTL mapping and GWAS results revealed that cis-acting causal variants should be an important consideration when selecting and combining favorable alleles across these key loci to optimize the tocochromanol profile of maize grain for human health and nutrition.
Data availability
All raw 3′ mRNA-seq data are available from the NCBI Sequence Read Archive under BioProject PRJNA643165. Supplementary Data Sets 1–4 are available on Cyverse (https://de.cyverse.org/data/ds/iplant/home/shared/GoreLab/dataFromPubs/Wu_AmesTocochromonols_2021). Supplementary tables and figures are available at figshare: https://doi.org/10.25386/genetics.19918309. All code is available on Github (https://github.com/GoreLab/Vitamaize_Ames_Toco).
Acknowledgments
We thank Matt Baseggio, Elise Albert, and other current and past members of the Gore, DellaPenna, Buell, and Yu labs for their efforts in pollination, harvest, and sample preparation.
Funding
This research was supported by the National Science Foundation (IOS-1546657 to JY, CRB, DDP, and MAG); the National Institute of Food and Agriculture; the USDA Hatch under accession numbers 1013641 and 1023660 (MAG), and 1021013 (JY); Cornell University startup funds (MAG); and HarvestPlus (MAG). This study was also made possible by the support of the American People provided to the Feed the Future Innovation Lab for Crop Improvement through the United States Agency for International Development (USAID). The contents are the sole responsibility of the authors and do not necessarily reflect the views of USAID or the United States Government. Program activities are funded by the United States Agency for International Development (USAID) under Cooperative Agreement No. 7200AA-19LE-00005 (MAG).
Conflicts of interest
None declared.
Literature cited
Author notes
Di Wu and Xiaowei Li contributed equally to this work.
