


Abstract
Determining mutation signatures is standard for understanding the etiology of human tumors and informing cancer treatment. Multiple determinants of DNA replication fidelity prevent mutagenesis that leads to carcinogenesis, including the regulation of free deoxyribonucleoside triphosphate pools by ribonucleotide reductase and repair of replication errors by the mismatch repair system. We identified genetic interactions between rnr1 alleles that skew and/or elevate deoxyribonucleoside triphosphate levels and mismatch repair gene deletions. These defects indicate that the rnr1 alleles lead to increased mutation loads that are normally acted upon by mismatch repair. We then utilized a targeted deep-sequencing approach to determine mutational profiles associated with mismatch repair pathway defects. By combining rnr1 and msh mutations to alter and/or increase deoxyribonucleoside triphosphate levels and alter the mutational load, we uncovered previously unreported specificities of Msh2–Msh3 and Msh2–Msh6. Msh2–Msh3 is uniquely able to direct the repair of G/C single-base deletions in GC runs, while Msh2–Msh6 specifically directs the repair of substitutions that occur at G/C dinucleotides. We also identified broader sequence contexts that influence variant profiles in different genetic backgrounds. Finally, we observed that the mutation profiles in double mutants were not necessarily an additive relationship of mutation profiles in single mutants. Our results have implications for interpreting mutation signatures from human tumors, particularly when mismatch repair is defective.
Introduction
Cancer is a genetic disease caused by mutation accumulation; DNA replication is an important source of mutation. Replicative polymerases, Polε and Polδ, minimize errors via a highly selective nucleotide-binding domain to prevent deoxynucleotide triphosphate (dNTP) misincorporation and an exonuclease domain to proofread and to remove errors (Kunkel 2004; McCulloch and Kunkel 2008; St Charles et al. 2015; Ganai and Johansson 2016). Together, these DNA polymerase functions provide a selectivity in which misincorporation errors occur at rates that are on the order of 1 × 10⁻⁷ (St Charles et al. 2015; Ganai and Johansson 2016). The mismatch repair (MMR) pathway acts on replication errors in vivo to produce significantly lower error rates of approximately 2 × 10⁻⁹ (McCulloch and Kunkel 2008; Ganai and Johansson 2016). Appropriate levels and ratios of the 4 dNTPs are also essential for maintaining high fidelity polymerase function. This has been demonstrated in yeast using mutations in allosteric sites of RNR1 that alter dNTP pools in different ways. RNR1 encodes the large subunit of the enzyme that catalyzes the rate-limiting step in dNTP synthesis, ribonucleotide reductase (RNR) (Nordlund and Reichard 2006; Hofer et al. 2012). Even a modest 2-times increase above normal levels, as seen in rnr1D57N, increased nucleotide misincorporation by DNA polymerases and elevated mutation rates (Chabes et al. 2003; Xu et al. 2008). More pronounced and skewed elevations in dNTP pools are generated in rnr1Y285F and rnr1Y285A, which increase dCTP and dTTP 3-times and 20-times, respectively (Kumar et al. 2010). These increases in dNTP pool levels further compromise replication fidelity (Kumar et al. 2010; Kumar, Abdulovic, et al. 2011; Buckland et al. 2014; Watt et al. 2016). Cancer cells have an increased proliferative nature and thus elevated dNTP pools may be necessary to support accelerated DNA replication (Davidson et al. 2012; Poli et al. 2012; Mathews 2015; Connor et al. 2017), which may, in turn, increase mutagenesis, promote molecular evolution, and provide a selective advantage to the tumor.
We previously developed a targeted deep-sequencing approach to characterize mutation profiles of these 3 rnr1 alleles (Lamb et al. 2021). We specifically selected for mutations within CAN1 and sequenced the mutant can1 genes at an average depth of 16,000 reads per nucleotide. The depth of sequencing allowed a more robust and nuanced analysis of mutation spectra than in previous work (Xu et al. 2008; Kumar, Abdulovic, et al. 2011; Buckland et al. 2014; Watt et al. 2016). We revealed genotype-specific mutation profiles, including mutation spectra, sequence context, and nucleotide motifs, with even modest changes in dNTP pools. Notably, all 3 rnr1 alleles exhibited increased CG>TA mutations and a shift in the relative distribution of single-base deletions toward G/C deletions, which are typically rare events in wild-type backgrounds (Lamb et al. 2021). The frequency of single-base G/C deletions was particularly elevated in rnr1Y285A. We suggested that the effects of altered dNTP pools on mutation profiles should be incorporated in the analysis of mutation signatures in human cancer (Lamb et al. 2021).
The variants we observed in the rnr1 backgrounds are typically substrates for MMR, which functions as a spell-check, recognizing and directing the repair of errors in replication (Kunkel and Erie 2015), thereby increasing the fidelity of replication by an additional 10–1,000 times (McCulloch and Kunkel 2008; Ganai and Johansson 2016). We and others have demonstrated combinatorial effects of rnr1 and mmr alleles on mutation rates (Xu et al. 2008; Kumar, Abdulovic, et al. 2011; Buckland et al. 2014; Watt et al. 2016), consistent with the prediction that mutations generated with altered rnr1 are substrates for MMR. Once recognized by an MutS homolog (Msh) complex, the misincorporation structures are targeted for excision. In most eukaryotes, 2 heterodimeric complexes bind errors at the replication fork: Msh2–Msh3 and Msh2–Msh6, which recognize a broad spectrum of mismatches and insertion/deletion loops (indels) with different but overlapping specificities. The current model of postreplicative MMR posits that Msh2–Msh3 recognizes, binds, and directs repair of indels up to 17-nucleotide long (Sia et al. 1997; Jensen et al. 2005), while Msh2–Msh6 targets mismatches and indels of 1–2 nucleotides. Msh2–Msh3 also has affinity for some mismatches, especially C–C, A–A, and (possibly) G–G (Harrington and Kolodner 2007; Srivatsan et al. 2014).
MMR is deficient in ∼25% of sporadic cancers caused by increased rate of mutagenesis (Mastrocola and Heinen 2010). Deficiencies in MMR genes MSH2, MSH6, PMS2, and MLH1 cause hereditary Lynch syndrome, which leads to a strong predisposition to cancers of the gastrointestinal tract, endometrial cancer, and lymphomas, and are defined by microsatellite instability (Pino et al. 2009; Heinen 2010). MMR mutations are also implicated in breast and ovarian cancer (Davies et al. 2017; Fusco et al. 2018). While Msh2–Msh3 has not been directly linked to Lynch syndrome, mutations in MSH3 lead to cancer predisposition within and outside the gastrointestinal tract (Edelmann et al. 2000; van Oers et al. 2014; Adam et al. 2016; Morak et al. 2017; Santos et al. 2018; Valle et al. 2019) as well as chemoresistant tumors (Takahashi et al. 2011; Park et al. 2013; Nogueira et al. 2018). Loss of MSH3 function leads to elevated alterations in selected tetranucleotide repeats, which is distinct from microsatellite instability and has been associated with a number of different cancers, including up to ∼60% of colorectal cancers (Carethers et al. 2015). Therefore, while MSH3 also plays a role in tumorigenesis, its role is distinct from that of Msh2–Msh6.
The multiplicative and synergistic effects of combining defects in both MMR and RNR1 on mutation rates of rnr1D57N msh2Δ, rnr1D57N msh6Δ (Xu et al. 2008), and rnr1Y285A msh2Δ (Buckland et al. 2014; Watt et al. 2016) indicated a genetic interaction between these pathways. We predicted that additional pathways would interact genetically with rnr1 alleles. We performed synthetic genetic array (SGA) screens (Baryshnikova et al. 2010a) to identify pathways that interact genetically with all 3 rnr1 alleles, identifying a number of pathways involved in DNA metabolism. Most strikingly, in the rnr1Y285A SGA screen, we identified essentially the entire MMR pathway. Therefore, we focused on the characterization of rnr1–MMR genetic interactions at the nucleotide level, using our targeted deep-sequencing approach (Xu et al. 2008; Kumar, Abdulovic et al. 2011; Buckland et al. 2014; Lamb et al. 2021) with an eye to developing a mechanistic understanding of mutation signatures that are observed in tumors. At the same time, the altered mutation profiles generated by rnr1 alleles (Lamb et al. 2021) allowed us to evaluate the role of Msh2–Msh3 and Msh2–Msh6 in directing the repair of typically rare replication errors. We characterized single mshΔ mutants and evaluated combinatorial effects on the mutation profiles when combined with rnr1 alleles. We identified novel and specific DNA substrates for Msh2–Msh3- vs. Msh2–Msh6-mediated MMR and demonstrated that mutation profiles of rnr1 mshΔ double mutants were not necessarily additive of the single mutant profiles, which has implications for the analysis of mutation signatures in human cancers.
Materials and methods
Strains and plasmids
All strains used for sequencing and mutator assays were derived from the W303 RAD5+ background (Supplementary Table 1). Strains used for the synthetic lethal screens were derived from S288C (Supplementary Table 1). Construction of rnr1D57N, rnr1Y285F and rnr1Y285A, with and without pGAL-RNR1, was described previously (Lamb et al. 2021). MMR genes were deleted by amplifying msh2Δ::kanMX, msh6Δ::kanMX, and msh3Δ::kanMX chromosomal fragments from deletion collection strains utilizing primers A and D specific to each locus (Supplementary Table 2). PCR products from these strains were used for transformation to replace the endogenous MSH gene with the kanMX cassette, which confers resistance to the drug, G418. Transformants were selected on YPD plates containing G418 and deletions were confirmed by PCR. We did not generate msh3Δ in the rn1Y285F/A-pGAL-RNR1 backgrounds.
Measuring mutation rates at CAN1
Mutation rates were measured at the CAN1 locus as previously described (Xu et al. 2008; Lamb et al. 2021). Briefly, strains were grown on complete media (YPD) until colonies reach 2 mm in size. Colonies were then suspended in 100 µl of 1× TE (10 mM Tris-HCl, pH 7.5; 1 mM EDTA) and diluted 1:10,000. Twenty microliters of the undiluted colony suspension was plated on SC-ARG + canavanine and 100 µl of the 10−4 dilution was plated on synthetic complete plates lacking arginine. The plates were incubated at 30°C until colonies reached ∼1 mm in size. Colonies were counted and mutation rates and 95% confidence intervals were calculated though FluCalc fluctuation analysis software (Radchenko et al. 2018). Assays were performed on multiple, independent isolates for each genotype on separate days. For rnr1Y285A mshΔ genotypes, we only tested isolates that retained the slow growth phenotype.
Synthetic genetic array analysis
The genetic screens were performed using SGA technology (Baryshnikova et al. 2010b). Briefly, query strains carrying each of the rnr1 alleles were crossed to an ordered array of all the viable yeast deletion strains and an array of temperature sensitive alleles of yeast essential genes. Diploid cells were transferred to a sporulation-inducing medium, after which the germinated spores were selected for the simultaneous presence of the gene deletion and the rnr1 allele. Colony size was quantified as a measure of fitness, and SGA scores and P-values were calculated as described in Baryshnikova et al. (2010b). SGA scores from deletion mutants and ts mutants were merged by scaling the ts screen scores according to the SGA scores of the 186 deletion mutants that are present in the ts allele array, as described (Costanzo et al. 2016). A z-score was calculated for all the genes in each screen, and a cutoff of z = −2 was applied to identify negative genetic interactions (Supplementary Table 3). The raw SGA data are presented in Supplementary Tables 4–9. Negative genetic interactions identified in each screen, and the overlaps between and among the negative genetic interactions, are presented in Supplementary Table 10.
Gene ontology enrichment analysis
Gene ontology (GO) term analysis was performed using the GO term finder tool (http://go.princeton.edu/) using a P-value cutoff of 0.01 and applying Bonferroni correction, querying biological process enrichment for each gene set. GO term enrichment results were further processed with REViGO (Supek et al. 2011) using the “Medium (0.7)” term similarity filter and simRel score as the semantic similarity measure. Terms with a frequency of greater than 15% in the REViGO output were eliminated as too general.
Spatial analysis of functional enrichment
Network annotations were made with the Python implementation of Spatial Analysis of Functional Enrichment (SAFE) (Baryshnikova 2016; https://github.com/baryshnikova-lab/safepy). The yeast genetic interaction similarity network and its functional domain annotations were obtained from (Costanzo et al. 2016).
Sample preparation and analysis pipeline
A detailed description of sample preparation and the analytical pipeline used for data analysis can be found in (Lamb et al. 2021). Briefly, we pooled ∼2,000 colonies CanR colonies for each biological replicate and extracted genomic DNA from the pool. Each genotype was represented by at least 4 independent biological replicates (Supplementary Table 11). The CAN1 gene was amplified by PCR using KAPA HiFi (Roche) in 6 overlapping fragments that were purified using the Zymo ZR-96 DNA Clean-up Kit. Nextera barcode adaptors were added to the amplicons, followed by attachment of Illumina Nextera XT index primers set A (Illumina). Excess adapters were removed using Ampure XP beads (Beckman Coulter). Pooled samples were diluted to 4 nM, denatured using NaOH and loaded onto an Illumina MiSeq sequencing platform (PE300, V3) with 20% PhiX control in 2 separate runs to increase coverage and as a check for reproducibility. Paired end (2 × 300) deep sequencing of CAN1 provided enough sequencing depth to determine mutation spectra for 150 unique samples, representing over 30 different genotypes, and including biological and technical replicates. CAN1 was sequenced at an average depth of approximately 16,000 reads per base in CAN1 per sample allowing for detailed characterization of mutation spectra.
Sequence reads were trimmed (CutAdapt version 1.14), specifying a quality score of Q30, and then processed using CLC Genomics Workbench Version 11. Paired-end reads were merged, primer locations were trimmed, and processed reads were aligned to the SacCer3 reference genome. CLC low frequency variant caller was used to call variants, with required significance of 0.01%. Variant files were exported from CLC as VCF files and downstream analysis was performed in RStudio (version 1.2.1335), paired with custom python scripting. Total variant frequency for each genotype is shown in Supplementary Fig. 1. All sequence variants are provided in Supplementary Table 24. Variants in wild-type, rnr1D57N, rnr1Y285F, rnr1Y285F pGAL-RNR1, rnr1Y285A and rnr1Y285A pGAL-RNR1 were characterized previously (Lamb et al. 2021) and are used here to compare single and double mutants.
Permissive variant filter
To assess the validity of our pipeline we included permissive samples grown in the absence of canavanine selection. We determined total variant frequency, by taking the number of variants that occurred in a sample and dividing by the number of reads. The permissive samples had an approximately 10 times lower total variant frequency, 8.7% compared to the samples selected on Canavanine, on average 99.4% (Supplementary Fig. 1). We used the permissive samples to inform a filtering approach to remove false positives from our data set. We developed the permissive filter to remove any variants that occurred below the average permissive variant allele frequency of 0.109%, as well as position specific mutations that occurred at a frequency above this cutoff. A detailed description of this filter can be found in (Lamb et al. 2021).
Cosine similarity analysis
We performed cosine similarity among all genotypes (Fig. 2a and Supplementary Fig. 2) to assess the relationship between genotype and mutation profile, using the lsa package in R. First, we performed this analysis across all samples in this study (Supplementary Fig. 2 and Supplementary Table 13). We generated a data matrix that contained all the unique variants within a sample and then determined cosine similarity scores based on the presence or absence of the variant within a sample. We then used the Heatmap2 package in R to show cosine similarity scores. Biological replicates from strains with lower mutation rates (e.g. wild type, msh3Δ, rnr1D57N) had lower cosine scores than those from strains with higher mutation rates (e.g. msh2Δ, msh6Δ, rnr1Y285A), indicating that mutation events occurred more systematically (less stochastically) in these genetic backgrounds.
We then combined biological replicates and performed cosine similarity analysis on the variant counts within a genotype (Fig. 2a and Supplementary Table 14). The number of times a variant occurred in all the biological replicates within a genotype was scored. The different classes of variants include 6 classes of single-nucleotide variants (SNVs), single-base A/T or G/C insertions and deletions, complex insertions and deletions, as well as mononucleotide variants (MNVs) and replacements (Replac.). MNVs are dinucleotide SNVs, where 2 neighboring nucleotides are both mutated, ex: CC> AT. Replacements are complex insertions or deletions, where the deleted or replaced base is a variant. Two examples include AAC > G and C > AT. Both MNVs and replacements are extremely low frequency events and rarely occur in our data set; neither had a significant impact on clustering.
The data were condensed based on genotype by combining biological replicates and adding the total number of times a variant was seen in the total number of replicates. This analysis does not take frequency into account and instead totals how many unique types of variants occur in a sample. If the same variant occurred in multiple biological replicates within a genotype it was counted as such. A data matrix with the number of times a variant occurred in biological replicates for a particular genotype was generated. We then performed cosine similarity analysis on this matrix and displayed these data using the Heatmap2 package in R.
Principal component analysis
Principal component analysis (PCA) was performed on the number of times a unique variant was observed within a genotype. PCA was plotted using the “factoextra” package in RStudio, with a singular value decomposition (SVD) approach using the prcomp() function.
Determining SNV in trinucleotide context
A 3-bp window surrounding each CAN1 SNV was identified. The average number of each SNV within this context, a total of 96 possible trinucleotide contexts (Lamb et al. 2021), was calculated for each genotype and divided by the number of times that context occurs in CAN1 (Alexandrov et al. 2015). The number of trinucleotide sequence contexts in CAN1 was calculated using a sliding window approach utilizing python scripting. For each of the 96 different SNV changes in triplet context, the average number of SNVs in a genotype was divided by the number of times the triplet sequence context occurs in CAN1. This dataset was imported into R-studio and plotted via the barplot() function. We also performed cosine similarity analysis on the normalized frequencies of SNVs in trinucleotide context in each genotype (Supplementary Table 22).
Cluster analysis for genotype-specific correlations
To identify variants specific to a particular genotype and to eliminate frequency bias from variants that occurred early in the growth of a particular sample, we condensed unique variants based on the number of biological replicates sequenced for that genotype. If a particular variant occurred in 4 out of 4 biological replicates it was represented as 1, if it occurred in 3 out of 6 replicates it was represented as 0.5. This gives an unbiased approach to score for the probability that a particular variant was present in a particular genotype, without considering the absolute frequency at which that variant occurred. These data were clustered on rows (or unique variants), after applying a row sum cutoff of greater than 2. This cutoff eliminates low frequency variants which are less likely to be driving the differences in mutation spectra that we observe. By clustering the data only on unique variants, it allows us to see groups of different types of variants in specific sequence contexts that are potentially diagnostic for a particular genotype.
To infer variants that were enriched in a particular genotype we divided the probabilities into 4 different bins (0–0.25, 0.26–0.50, 0.51–0.75, and 0.76–1.0). A variant was positively enriched in a genotype if it occurred at 0.76 or greater probability, and negatively enriched if it occurred below a 0.25 probability. Variants were grouped for motif enrichment (black boxes) based on the main branches in the dendrogram, paired with similar patches of enrichment on the heatmap. It is worth noting the majority of variants that were negatively enriched did not occur at all in a given genotype (light blue on heatmap). On average there was greater than a 2 times increase in probability for variants that were positively enriched.
CC dinucleotide cluster analysis
A python script using a sliding window approach was used to identify all reference positions containing CC dinucleotides within CAN1. Our dataset was then subset to include only variants that occurred in these dinucleotide CC positions. Of the 138 CC dinucleotide contexts across CAN1, 110 (∼80%) were mutated, compared to 857/1,711 base pairs or ∼50% of the base pairs in CAN1. Unique CC run variants were clustered based on the number of times that variant occurred in each genotype, while accounting for (normalizing by) the number of biological replicates sequenced for each genotype, as described above. Heatmaps were plotted using the pheatmap package in RStudio and motif enrichment was performed using Berkeley web logos (Crooks et al. 2004).
COSMIC single-base substitution signature cluster analysis
We performed cosine similarity analysis to compare the mutation spectra from our study with human mutation signatures, through an unbiased approach. The single-base substitutions (SBS) COSMIC signatures from GRCh38 (v3.2, March 2021, https://cancer.sanger.ac.uk/signatures/sbs/) were combined with the normalized SNVs in trinucleotide context (Fig. 4) (Alexandrov et al. 2020). Cosine similarity scores were calculated using the lsa package in R and data was visualized as a heatmap, as described above (Supplementary Table 23).
Results
Pathways in DNA metabolism, including MMR, interact genetically with rnr1 alleles
Previous work (Xu et al. 2008; Buckland et al. 2014; Watt et al. 2016) demonstrating the combined effect of rnr1 alleles and msh deletions on mutation rates suggested that together these genes contribute to increased replication fidelity, and therefore they might show synergistic effects on cell fitness. We predicted that other pathways also interact genetically with rnr1 alleles that altered dNTP pools. Therefore, we performed synthetic genetic array (SGA) analysis using each of 3 different rnr1 alleles (Fig. 1 and Supplementary Tables 3–10). The rnr1Y285A query had the greatest number of genetic interactions, consistent with the Y285A mutation having the highest increase in dNTP levels. The 3 rnr1 alleles showed surprisingly little overlap in their genetic interactions (Fig. 1a and Supplementary Table 10), supporting the idea that different dNTP levels and pool balances stress cells in different ways. Both the rnr1Y285A screen and the rnr1D57N screen showed enrichment for the GO term “DNA replication” (Fig. 1b) in addition to displaying unique enrichments for “maintenance of DNA repeat elements” and “DNA repair” (rnr1Y285A) and “lagging strand replication” (rnr1D57N). The rnr1Y285F screen did not show any statistically supported GO term enrichment and interacted with only a single “DNA replication” gene, POL31. To further assess the functional properties of each rnr1 allele’s genetic interactions, we applied SAFE (Baryshnikova 2016) to determine if any regions of the functional genetic interaction similarity yeast cell map (Costanzo et al. 2016) are overrepresented for the negative genetic interaction gene sets (Fig. 1c). We found a statistically supported overrepresentation of the negative interacting genes in the DNA replication and repair neighborhood of the genetic interaction cell map for all 3 rnr1 alleles, indicating that dNTP pool alterations impinge most dramatically on the DNA replication and DNA repair capacity of the cell. As with GO term enrichment, differences among the 3 rnr1 alleles were also apparent in the SAFE analysis, with rnr1Y285A and rnr1D57N interactors being overrepresented in the chromatin organization neighborhood compared with rnr1Y285F, and rnr1Y285F and rnr1Y285A interactors showing more overrepresentation in the mitosis neighborhood than did rnr1D57N interactors.
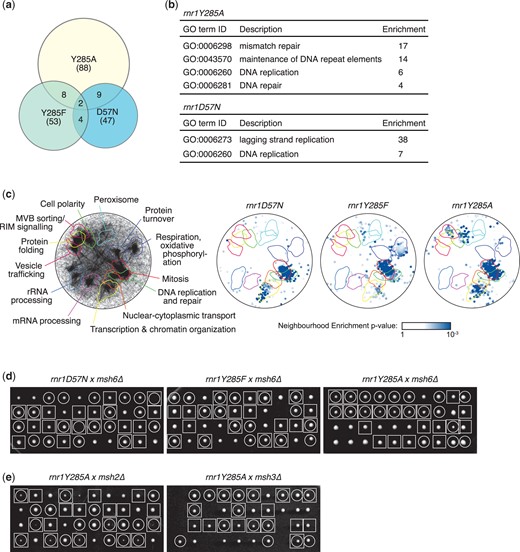
Genome-scale screens for synthetic fitness defects with rnr1 alleles. a) The overlap of the rnr1-negative genetic interactions for the 3 SGA screens is plotted as a Venn diagram. The number of genes identified in each screen is indicated, as is the rnr1 allele for each screen. b) GO-term enrichments for the negative interacting genes from each rnr1 screen are tabulated. The enrichment for each term is indicated. Note that rnr1Y285F did not display any statistically supported enrichment. c) SAFE. On the left, the yeast genetic interaction similarity network is annotated with GO biological process terms to identify major functional domains (Costanzo et al. 2016). Thirteen of the 17 domains are labeled and delineated by colored outlines. On the right, the network is annotated with negative genetic interactions from each rnr1 SGA screen. The overlays indicate the functional domains annotated on the left. Only nodes with statistically supported enrichments (SAFE score > 0.08, P < 0.05) are shown. d) Tetrad analysis of rnr1 × msh6Δ crosses. Ten tetrads were dissected for each cross, and colonies were imaged after 3 days. Each column of 4 colonies is the 4 spores from a single meiotic ascus. Genotypes are indicated by circles (msh6Δ) and squares (rnr1). e) Tetrad analysis of rnr1Y285A × msh2Δ and rnr1Y285A × msh3Δ crosses. Genotypes are indicated by circles (msh2Δ or msh3Δ) and squares (rnr1Y285A).
Most notably, we found that almost the entire MMR pathway (MSH2, MSH6, MLH1, PMS1, and EXO1) was identified specifically in the rnr1Y285A screen and the “MMR” GO term was very strongly and specifically enriched in the rnr1Y285A screen (Fig. 1b). This indicates a strong requirement for the MMR pathway when dNTP pools are highly unbalanced. We validated the specificity of the genetic interaction between MMR and rnr1Y285A by performing the tetrad analysis of msh6Δ crosses with each of the 3 rnr1 alleles (Fig. 1d). Fitness defects in double mutant colonies were only evident in the rnr1Y285A cross. In tetrad analysis, msh6Δ, and particularly msh2Δ, showed stronger fitness defects when combined with rnr1Y285A than did msh3Δ (Fig. 1e), consistent with the reduced viability observed in mutation rate experiments (Table 1) and with msh3Δ being just below our cutoff in the rnr1Y285A SGA (Supplementary Table 3). Our genetic interaction data indicate that all 3 rnr1 alleles interface with DNA replication and repair pathways and that rnr1Y285A might be expected to have a particularly dramatic effect in MMR-deficient cells.
Forward mutation rate at CAN1 as measured by resistance to canavanine.
| Genotype | Mutation rate (95% confidence intervals) | Change relative to wild type |
|---|---|---|
| Wild type (n = 115) | 2.7 × 10⁻⁷ (2.3 × 10⁻⁷–3.2 × 10⁻⁷) | 1 |
| msh2Δ (n = 24) | 6.7 × 10⁻⁶ (5.8 × 10⁻⁶–7.8 × 10⁻⁶) | 24.8 |
| msh3Δ (n = 32) | 7.8 × 10⁻⁷ (6.1 × 10⁻⁷–9.7 × 10⁻⁷) | 2.9 |
| msh6Δ (n = 24) | 1.8 × 10⁻⁶ (1.4 × 10⁻⁶–2.2 × 10⁻⁶) | 6.7 |
| rnr1D57N (n = 91) | 7.3 × 10⁻⁷ (6.3 × 10⁻⁷–8.3 × 10⁻⁷) | 2.7 |
| rnr1D57N msh2Δ (n = 24) | 2.0 × 10⁻⁵ (1.8 × 10⁻⁵–2.3 × 10⁻⁵) | 74.1 |
| rnr1D57N msh3Δ (n = 24) | 2.2 × 10⁻⁶ (1.7 × 10⁻⁶–2.7 × 10⁻⁶) | 8.2 |
| rnr1D57N msh6Δ (n = 24) | 5.6 × 10⁻⁶ (4.7 × 10⁻⁶–6.6 × 10⁻⁶) | 20.7 |
| rnr1Y285F (n = 42) | 7.5 × 10⁻⁷ (5.8 × 10⁻⁷–9.5 × 10⁻⁷) | 2.8 |
| rnr1Y285F msh2Δ (n = 24) | 2.9 × 10⁻⁵ (2.6 × 10⁻⁵–3.2 × 10⁻⁵) | 107.4 |
| rnr1Y285F msh3Δ (n = 24) | 3.7 × 10⁻⁶ (3.0 × 10⁻⁶–4.5 × 10⁻⁶) | 13.7 |
| rnr1Y285F msh6Δ (n = 24) | 2.3 × 10⁻⁵ (2.0 × 10⁻⁵–2.6 × 10⁻⁵) | 85.2 |
| rnr1Y285F pGAL-RNR1 (n = 24) | 7.8 × 10⁻⁷ (5.7 × 10⁻⁷–1.0 × 10⁻⁶) | 2.9 |
| rnr1Y285F pGAL-RNR1 msh2Δ (n = 24) | 1.5 × 10⁻⁵ (1.3 × 10⁻⁵–1.8 × 10⁻⁵) | 55.6 |
| rnr1Y285F pGAL-RNR1 msh6Δ (n = 12) | 1.6 × 10⁻⁵ (1.3 × 10⁻⁵–1.9 × 10⁻⁵) | 59.3 |
| rnr1Y285A (n = 46) | 5.5 × 10⁻⁶ (4.7 × 10⁻⁶–6.2 × 10⁻⁶) | 20.4 |
| rnr1Y285A msh2Δ (n = 33) | 2.5 × 10⁻⁵ (2.1 × 10⁻⁵–3.0 × 10⁻⁵) | 92.6 |
| rnr1Y285A msh3Δ (n = 49) | 6.2 × 10⁻⁵ (5.7 × 10⁻⁵–6.6 × 10⁻⁵) | 229.6 |
| rnr1Y285A msh6Δ (n = 33) | 1.0 × 10⁻⁵ (8.9 × 10⁻⁶–1.2 × 10⁻⁵) | 37.0 |
| rnr1Y285A pGAL-RNR1 (n = 22) | 1.5 × 10⁻⁵ (1.2 × 10⁻⁵–1.7 × 10⁻⁵) | 55.6 |
| rnr1Y285A pGAL-RNR1 msh2Δ (n = 24) | 1.3 × 10⁻⁵ (1.1 × 10⁻⁵–1.5 × 10⁻⁵) | 48.2 |
| rnr1Y285A pGAL-RNR1 msh3Δ (n = 36) | 7.3 × 10⁻⁵ (6.8 × 10⁻⁵–7.9 × 10⁻⁵) | 270.4 |
| rnr1Y285A pGAL-RNR1 msh6Δ (n = 30) | 1.0 × 10⁻⁵ (8.7 × 10⁻⁶–1.2 × 10⁻⁵) | 37.0 |
Combining rnr1 and mshΔ alleles significantly increased mutation rates
The striking MMR interaction with rnr1Y285A, along with the combinatorial effects of rnr1D57N with msh2Δ or msh6Δ (Xu et al. 2008), encouraged us to focus on the combined effects of mshΔ and rnr1 alleles on mutation profiles. To determine whether the rnr1 msh double mutants displayed the anticipated increases in mutagenesis, we measured the forward mutation rates at CAN1 (Table 1). It is worth noting that it has been demonstrated previously that msh2Δ does not alter dNTP pools, alone or in combination with rnr1Y285A (Kumar, Abdulovic, et al. 2011; Watt et al. 2016). The relative mutation rates for msh deletions were consistent with previous observations (Marsischky et al. 1996; Xu et al. 2008; Kumar, Abdulovic, et al. 2011; Lang et al. 2013), with msh2Δ exhibiting the highest mutation rate, msh6Δ exhibiting a lower but still increased mutation rate, and msh3Δ exhibiting a mild mutator effect in this assay (Table 1). The rnr1 mutation rates increased with increasing dNTP levels as expected (Kumar et al. 2010), with rnr1Y285A showing a 20 times increase above the wild-type mutation rate (Table 1). When rnr1D57N and rnr1Y285F were combined with msh deletions, the mutation rates exhibited the same hierarchy (msh2Δ > msh6Δ > msh3Δ), but with higher rates than either of the relevant single mutants (Table 1). In most cases, the mutation rate of the double mutant approximated the product of the single mutant mutation rates. The rnr1Y285F msh6Δ strain had a particularly large increase, 85 times above wild type, compared to the expected 19 times increase given the mutation rates of the respective single mutants (Table 1). Notably, rnr1Y285A msh3Δ exhibited a strong, synergistic mutator phenotype, indicating that the mutations generated in the presence of rnr1Y285A are substrates for Msh2–Msh3-mediated MMR. It is possible that the mutation rates for rnr1Y285A msh2Δ and rnr1Y285A msh6Δ are underestimates, due to fitness defects in these strains, consistent with our SGA results (Fig. 1) and previously published fitness data (Watt et al. 2016).
MMR genotype-specific variant profiles with msh3Δ genotypes separated from msh2Δ, msh6Δ genotypes
We applied targeted deep sequencing of CAN1 (Lamb et al. 2021) to define and to characterize mutation profiles in rnr1 mshΔ backgrounds, to derive mutation profiles from first principles.
We first selected ∼2,000 canavanine resistant (CanR) colonies (selected samples) for each different genetic backgrounds. By definition, each of these colonies should have sustained a mutation in CAN1 that inactivates its gene product and allows cells to grow in the presence of canavanine. Multiple biological replicates for each strain were sequenced (Supplementary Table 11). The CanR colonies were pooled and genomic DNA was extracted. The CAN1 gene was then amplified in 6 overlapping fragments, bar-coded, and subjected to Illumina paired-end sequencing (Lamb et al. 2021). To assess the effectiveness of our selection method and gain insight into baseline mutations, we calculated total variant frequency for each genotype, by summing the variants in each replicate/genotype and dividing by total sequencing reads. When strains were selected in the presence of canavanine, we observed an average total variant frequency of 99.4% (Supplementary Fig. 1a). In contrast, strains grown in the absence of selection (permissive samples) exhibited an average total variant frequency of 8.7%, likely a result of a combination of low-level CAN1 mutations and PCR/sequencing artifacts. To address the latter, we applied a permissive variant filter that removed any variants at a frequency of below 0.109%. This cutoff is conservative and is based on the average frequency of individual variants in permissive samples (grown in the absence of selection) and the positions in which they occurred (Lamb et al. 2021) (Supplementary Fig. 1b). To minimize false positives, it is likely that this approach will have eliminated some legitimate low frequency variants.
This targeted deep-sequencing approach identified primarily base substitution and small insertion/deletion mutations; rearrangements will not be easily identified (Lamb et al. 2021). Furthermore, there is a bias toward mutations that inactivate the CAN1 gene product, arginine permease, although we did observe about 3% synonymous mutations (data not shown). Nonetheless, the depth of sequencing (∼16,000× coverage at each nucleotide) and large number of total variants observed in each genotype (Table 2) revealed novel insights into DNA substrate preferences of Msh2–Msh3- or Msh2–Msh6-mediated MMR.
Total number of mutations at any position within CAN1 observed per genotype.
| Genotype | No. variants |
|---|---|
| WTa | 267,057 |
| msh2Δ | 120,472 |
| msh3Δ | 122,768 |
| msh6Δ | 95,701 |
| rnr1D57Na | 205,223 |
| rnr1D57N msh2Δ | 185,107 |
| rnr1D57N msh3Δ | 72,482 |
| rnr1D57N msh6Δ | 88,642 |
| rnr1Y285Fa | 171,257 |
| rnr1Y285F msh2Δ | 94,742 |
| rnr1Y285F msh3Δ | 79,330 |
| rnr1Y285F msh6Δ | 104,984 |
| rnr1Y285F pGAL-RNR1a | 114,080 |
| rnr1Y285F pGAL-RNR1 msh2Δ | 177,905 |
| rnr1Y285F pGAL-RNR1 msh6Δ | 100,200 |
| rnr1Y285Aa | 106,165 |
| rnr1Y285A msh2Δ | 153,727 |
| rnr1Y285A msh3Δ | 98,643 |
| rnr1Y285A msh6Δ | 166,704 |
| rnr1Y285A pGAL-RNR1a | 176,405 |
| rnr1Y285A pGAL-RNR1 msh2Δ | 110,899 |
| rnr1Y285A pGAL-RNR1 msh3Δ | 97,346 |
| rnr1Y285A pGAL-RNR1 msh6Δ | 101,992 |
These variants were characterized in Lamb et al. (2021),
We characterized mutation events in 2 ways (Supplementary Table 12), as previously described (Lamb et al. 2021). First, we determined the number of a specific variant type, i.e. the number of C>A changes, at different positions along can1 (“unique counts”) (counts in Supplementary Table 12). Second, we calculated the frequency at which each of these unique variants occurred, i.e. the combined frequency of all C>A changes at any position along can1 (“sum of frequencies”) (freq. in Supplementary Table 12). These analyses allowed us to determine whether different types of mutations occurred at specific locations in a genotype-dependent manner, independent of frequency, and whether variant frequencies were altered in a significant way by genotype (counts/freq. in Supplementary Table 12). A decreased number for “unique counts” combined with unchanged or increased “sum of frequencies” would indicate that variant type is more localized, possibly indicating a mutational hotspot. For instance, msh6Δ exhibited the highest proportion of unique events contributing to the mutation spectrum (counts/freq. = 1.62; Supplementary Table 12). In contrast, rnr1Y285F msh3Δ and rnr1Y285A msh3Δ exhibited the lowest proportion of unique variants; the mutation spectra were instead dominated by G/C single-base deletions, which occur at high frequencies (Supplementary Table 12).
We performed cosine similarity analysis to determine the quantitative relationship between mutation profile and genotype (see Materials and methods). All unique variants for all genotypes were assessed in parallel, based on both the presence and frequency of unique variants, as described above. In general, biological replicates of the same genotype had high cosine similarity scores and clustered because their mutational profiles were highly correlated (Supplementary Fig. 2 and Supplementary Table 13). Therefore, we combined variants from all biological replicates within a genotype for the remainder of our analyses. Cosine similarity analysis performed on unique variants between genotypes was consistent with genotype-specific mutation profiles (Fig. 2a, Supplementary Fig. 2 and Supplementary Table 14), as was PCA based on unique variants (Fig. 2b). Most notably, msh2Δ and msh6Δ backgrounds segregated away from msh3Δ backgrounds. Combined, these results indicated that it is possible to distinguish among genotypes based on unique variant profiles observed from can1 deep sequencing.
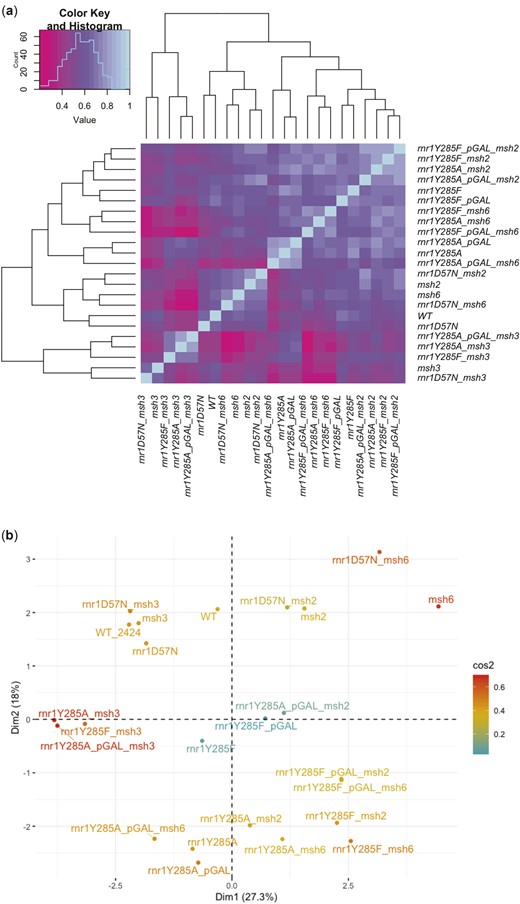
Distinct genotypes share unique features. a) Cosine similarity analysis was performed on the unique counts of the 14 different classes of variants that occurred in each genotype (Supplementary Table 14). The histogram shows the distribution of cosine similarity scores across samples. b) Principal component analysis performed on all unique variants from biological replicates within a genotype.
Previous work characterized rnr1Y285F and rnr1Y285A (± MSH2) in backgrounds that carried a silenced pGAL-RNR1 gene (i.e. grown in the absence of galactose) (Kumar et al. 2010; Buckland et al. 2014). We previously demonstrated that the mutation profiles of these strains were comparable to rnr1Y285F and rnr1Y285A without the pGAL-RNR1 construct (Lamb et al. 2021). They are included here, with and without MSH genes to provide a comparison with that previous work. In general, pGAL-RNR1 did not impact the observed mutation rates (Table 1) or profiles (Supplementary Fig. 2–4), although there were some differences in specific variants (Supplementary Fig. 4).
Targeted deep sequencing revealed novel substrate preferences for Msh2–Msh3- vs. Msh2–Msh6-mediated MMR
Previous studies of mutation spectra in the absence of MMR have focused primarily on msh2Δ (Lang et al. 2013; Buckland et al. 2014; Serero et al. 2014; Watt et al. 2016), which effectively eliminates all MMR activity and retains errors made by replicative polymerases (Kunkel and Erie 2005). In contrast, studies of mutation spectra in msh3Δ and msh6Δ analyzed fewer than 100 colonies via Sanger sequencing (Sia et al. 1997; Harrington and Kolodner 2007; Xu et al. 2008), preventing statistically supported conclusions about variant types. We examined mutation profiles in the absence of MSH2 (msh2Δ). We also removed only Msh2–Msh6 (msh6Δ) or Msh2–Msh3 (msh3Δ) to assess the substrate specificity and repair efficiency of each complex. In general, the msh2Δ, msh3Δ, and msh6Δ mutation profiles in the current study were consistent with previous studies performed in yeast: msh2Δ and msh3Δ profiles were dominated by indels, particularly deletions in repetitive regions, while msh6Δ profiles were dominated by SNVs (Sia et al. 1997; Harrington and Kolodner 2007; Xu et al. 2008; Kumar, Piacente, et al. 2011; Lang et al. 2013; Buckland et al. 2014; Serero et al. 2014). We did not, however, observe the same bias toward transitions vs. transversions previously observed in WGS of msh2Δ (Lang et al. 2013; Serero et al. 2014; Watt et al. 2016). Nonetheless, the substantially increased sample number and sequencing depth revealed some novel specificities. Deleting MSH2 resulted in a relative decrease in SNVs and increased deletions and insertions compared to wild type (Fig. 3a andSupplementary Fig. 4), with A/T single-base deletions (A/T-1) dominating the mutation profile (Supplementary Table 12, Fig. 3c, green bar, and Supplementary Fig. 4). In contrast, the msh6Δ spectrum was dominated by SNVs, which represented >80% of the mutations (Supplementary Table 12, Fig. 3, a and b, and Supplementary Fig. 4), although the types of SNVs generated were similar for msh2Δ and msh6Δ (Supplementary Table 12, Fig. 3b, and Supplementary Fig. 4). In msh3Δ cells, deletion events prevailed, similar to msh2Δ, but there was a marked increase in G/C-1 bp deletions and complex deletions and insertions (>1 bp) compared to wild type, msh2Δ, or msh6Δ (Fig. 3c, Supplementary Table 12, and Supplementary Fig. 4), consistent with the preference of Msh2–Msh3 for binding larger indels (Habraken et al. 1996; Sia et al. 1997; Surtees and Alani 2006). Approximately 30% of the mutations that accumulated in msh3Δ were SNVs, but again the distribution was distinct, with increased CG>GC and TA>AT changes compared with msh2Δ and msh6Δ (Supplementary Table 12, Fig. 3a, and Supplementary Fig. 4), despite the fact that these errors should be efficiently repaired by Msh2–Msh6 (Genschel et al. 1998; Bowers et al. 1999). This is consistent with Msh2–Msh3 in vitro affinity of C–C, A–A, and G–G mispairs (Srivatsan et al. 2014). In contrast, there were fewer TA>CG changes in msh3Δ compared to msh2Δ and msh6Δ (Supplementary Table 12 and Fig. 3a). These observations are consistent with Msh2–Msh3 playing a role in correcting a specific subset of misincorporation events (Harrington and Kolodner 2007; Kumar, Piacente, et al. 2011).
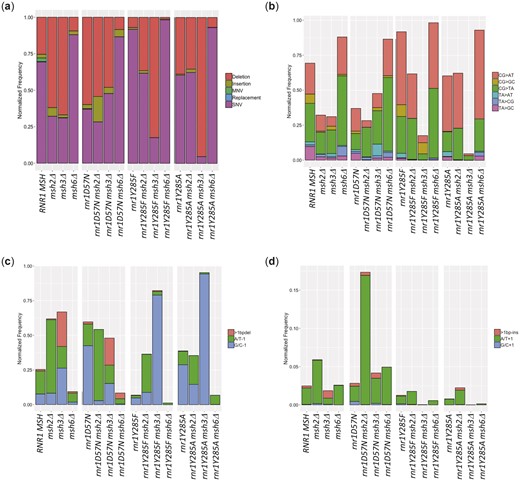
Mutation spectra are distinct across genotypes. a) The relative distribution of: deletions (coral), insertions (olive), MNVs (green), replacements (blue) and single-nucleotide polymorphisms (SNVs; coral) by genotype. b) The SNV spectra normalized relative total variants. Our sequencing approach does not allow us to determine which strand was originally mutated and, therefore, we use notation that indicates the base pair that is changed. Using this notation, there are 6 possible SNVs: C/G to A/T variants (CG>AT; coral), C/G to G/C variants (CG>GC; copper), C/G to T/A variants (CG>TA; green), T/A to A/T variants (TA>AT; teal), T/A to C/G variants (TA>CG; blue) and T/A to G/C variants (TA>GC; magenta). c) The deletion spectra normalized relative to total variants. We observed 3 types of deletions: deletions of more than 1 base pair (>1bpdel; coral), deletion of 1 A/T base pair (A/T-1; green), and deletion of 1 G/C base pair (G/C-1; blue). d) The insertion spectra normalized relative to total variants. We observed 3 types of insertions: insertions of more than 1 base pair (>1bp-ins; coral), insertions of 1 A/T base pair (A/T + 1; green), and insertions of 1 G/C base pair (G/C + 1; blue). To compare the individual frequencies between genotypes, we took the average frequency and calculated the standard error of the mean (SEM) (Supplementary Fig. 4). Error bars are not shown here for ease of viewing the data.
In assessing the ability of Msh2–Msh3 and Msh2–Msh6 to direct the repair of replication errors using msh alleles, we are limited to evaluating repair of those mutations that arise because of replication error. Due to the inherent proofreading activity of Polδ and Polε, this rate is low and certain mutations are very rare (Kunkel 2009; Arana and Kunkel 2010; Kunkel 2011). However, rnr1 alleles generate distinct mutation profiles, including variants that are rare in wild-type backgrounds (Kumar, Abdulovic, et al. 2011; Buckland et al. 2014; Watt et al. 2016; Lamb et al. 2021). To evaluate the specificity of MMR MSH complexes for a broader range of mutations and to assess the impact of combined genotypes on mutation profiles, we combined msh deletions with rnr1 alleles. Notably, dNTP pools are likely elevated in cancer cells (Aye et al. 2015; Mathews 2015), including those caused by defects in MMR. Therefore, the effect of the combination of mshΔ and altered dNTPs on replication fidelity could result in unique mutation signatures observed in tumors.
When msh2Δ was combined with each rnr1 allele, distinct mutation spectra (i.e. the proportion of each type of variant) were observed (Supplementary Table 12 and Fig. 3a). The rnr1D57N, rnr1Y285F, and rnr1Y285A profiles exhibited an increase in the proportion of G/C-1 deletions relative to A/T-1 deletions compared to wild type (Fig. 3c). The opposite trend was observed in msh2Δ and in the rnr1 msh2Δ backgrounds (Fig. 3c). This indicated that, while elevated/skewed dNTPs increase the proportion of G/C-1 variants, A/T-1 deletions are preferentially repaired in the presence of MMR. There was also a significant increase in A/T + 1 insertions in rnr1D57N msh2Δ relative to either single mutant (Fig. 3d, Supplementary Table 12, and Supplementary Fig. 4). Finally, while the rnr1Y285F and rnr1Y285A SNV profiles were biased toward CG>TA and CG>AT SNVs, rnr1Y285F msh2Δ and rnr1Y285A msh2Δ were almost completely dominated by these variants, with proportions that differed from either single mutant (Supplementary Table 12, Fig. 3b, and Supplementary Fig. 4). These SNV profiles indicated that: (1) DNA polymerases primarily generated these errors when dCTP and dTTP were modestly skewed and elevated (rnr1Y285F) and (2) these elevated frequencies began to saturate MMR activity and/or these errors are inefficiently repaired by MMR.
Deleting MSH6 in combination with rnr1 alleles, so that only Msh2–Msh3-mediated MMR was present, resulted in unique shifts in mutagenesis across can1 (Supplementary Table 12 and Fig. 3a). The effect was most dramatic in rnr1Y285F msh6Δ with a profile that was almost completely dominated by CG>TA and CG>AT SNV errors (Supplementary Table 12, Fig. 3, b and c, and Supplementary Fig. 4), indicating that Msh2–Msh3 is not efficient in correcting these mismatches. The proportion of CG>AT transversions was even higher in rnr1Y285A msh6Δ, although most of the variant classes were still observed. In both rnr1Y285F msh6Δ and rnr1Y285A msh6Δ, there was almost a complete loss of the G/C-1-bp deletions that were observed at an increased frequency in rnr1Y285F and rnr1Y285A (Supplementary Table 12, Fig. 3, c and d, and Supplementary Fig. 4), consistent with the efficient repair of G/C-1-bp slippage events by Msh2–Msh3-mediated MMR. Strikingly, the opposite was observed in the absence of Msh2–Msh3 (msh3Δ). In both rnr1Y285F msh3Δ and rnr1Y285A msh3Δ, there was a dramatic increase in G/C-1-bp deletions compared to either single mutant, almost to the exclusion of any other variants, indicating that Msh2–Msh6 was unable to correct this type of error (Fig. 3c, Supplementary Table 12, and Supplementary Fig. 4).
Genotype-specific position susceptibility to mutation within CAN1
We observed genotype-specific positions within CAN1 that were susceptible to mutation, i.e. mutational “hotspots” (Supplementary Tables 15–21). We previously identified novel susceptible positions in rnr1D57N, rnr1Y285F, and rnr1Y285A (Lamb et al. 2021), many of which were associated with repetitive DNA sequences, particularly insertions and deletions. In this study, we defined susceptible positions as those in which the same variant was observed at the same position in >50% of biological replicates. Of the 49 susceptible positions in msh2Δ, 9 were unique to this genotype (Supplementary Table 18). The remaining positions overlapped with those observed in msh3Δ and/or msh6Δ. Approximately 2/3 (61 of 96) of the susceptible mutations in msh6Δ were specific to this genotype and were predominantly SNVs. None of the 18 msh3Δ susceptible sites were unique to msh3Δ; 4 were also observed in msh2Δ while the remaining 9 were also observe in msh6Δ. All variants were more likely to occur at or adjacent to repetitive sequences, although the specific repetitive sequences varied by genotype.
We observed more distinct profiles of susceptible positions in CAN1 when msh deletions were combined with rnr1 alleles, typically differing from the individual single mutants in the number of replicates affected and/or the frequency of mutation. The susceptible positions in rnr1Y285A msh2Δ identified in our study largely overlapped with previously identified “hotspots” (Kumar, Abdulovic, et al. 2011; Buckland et al. 2014), but our analysis also revealed new susceptible positions (Supplementary Tables 15 and 22). One noteworthy position is 527 (chromosome V coordinate 32,940), which occurs in A/T-rich sequence (5′-TTTTCTTGG/CCAAGAAAA) and is susceptible to C/G>A/T mutation in rnr1Y285A msh2Δ and rnr1Y285A-pGAL msh2Δ. The variant frequency at this position increased synergistically in rnr1Y285A-pGAL msh2Δ and rnr1Y285A msh2Δ double mutants, occurring at a frequency at least 10 times greater than the single mutants. C/G>T/A SNVs also occurred in a variety of msh6Δ genotypes at this position, indicating decreased replication fidelity in this context. Notably, the majority of susceptible positions in rnr1Y285A msh2Δ are also susceptible in rnr1Y285A but not msh2Δ, indicating that highly skewed/elevated dCTP and dTTP levels promoted specific errors to a level where MMR was invoked, and approached saturation of the MMR system. In contrast, rnr1Y285A msh6Δ and rnr1Y285A msh3Δ tended to exhibit susceptible positions that were distinct from either single mutant, consistent with different specificities of Msh2–Msh3 and Msh2–Msh6-directed repair in the presence of a distinct mutational baseline observed in the presence of rnr1 alleles.
We also noted increased insertion and deletion events in repetitive runs, similar to previous work (Lujan et al. 2014; St Charles et al. 2015), although there are only short homopolymer runs in CAN1. Notably, some G/C deletions occurred adjacent to repetitive runs in a genotype-specific manner. For example, a GΔ at CAN1 position 449 (chromosome V: 33018) was specific to msh3Δ, with dinucleotides nearby upstream and downstream (5′-GTTACATCC/GGATGTAAC) (Supplementary Table 24).
Insertions and deletions involving more than 1 nucleotide were rare but occurred at increased frequency in msh3Δ. The complex insertion of CT in the repetitive run stretching from CAN1 positions 255–261 (chromosome V: 33209–33215) (5′-GAGAGAGACTTAAG/CTTAAGCTCTCTC) is noteworthy. It was observed almost exclusively in msh2Δ genotypes, and more frequently when paired with rnr1 alleles. The increased CT insertion in rnr1 msh2Δ genotypes indicates that positions 255–261 were particularly susceptible to mutation when dNTPs were elevated, even by a small amount as is the case in rnr1D57N. However, the CT insertion was very efficiently repaired by either Msh2–Msh3 or Msh2–Msh6-directed MMR as it was not observed in either msh3Δ or msh6Δ (Supplementary Table 24).
Unique mutation signatures revealed by variant sequence context analysis
Genotype-specific susceptible positions indicated that sequence context was affecting the mutation profile in different genetic backgrounds. Therefore, we took 2 related approaches: (1) trinucleotide context and (2) motif analysis, to gain information about sequence context that might influence either replication errors or MMR activity. First, we assessed the SNV profile as a function of trinucleotide context, i.e. the identity of the nucleotide immediately 5′ and 3′ to a given variant (Fig. 4). This is an accepted way to analyze and compare base substitution profiles (insertions and deletions were not included) (Blokzijl et al. 2018; Alexandrov et al. 2020; Tracy et al. 2020; Lamb et al. 2021). We determined the average number of times an SNV was observed in a particular triplet context per genotype, normalized by the number of times the triplet context occurs in CAN1 (Fig. 4). Here, we highlight a few examples. First, C→T changes (red bars, Fig. 4), particularly in GCC and GCG sequence contexts, dominated in all genotypes, but most dramatically in rnr1Y285F and rnr1Y285A samples, as we previously observed (Lamb et al. 2021) and consistent with whole genome sequencing in rnr1Y285A (Watt et al. 2016), possibly as a result of increased extension after misincorporation of dTTP, which is in excess, superseding proofreading (Kunkel and Soni 1988). Notably, no C>T SNVs occurred in the GCT context in wild type, msh3Δ, rnr1D57N msh3Δ, or rnr1D57N, but were observed in all rnr1Y285A and rnr1Y285F double mutant backgrounds, albeit at relatively low frequencies. This example shows an error that was specific to skewed increases in dCTP and dTTP and was efficiently repaired by Msh2–Msh6 (msh3Δ) but not Msh2–Msh3 (msh6Δ).
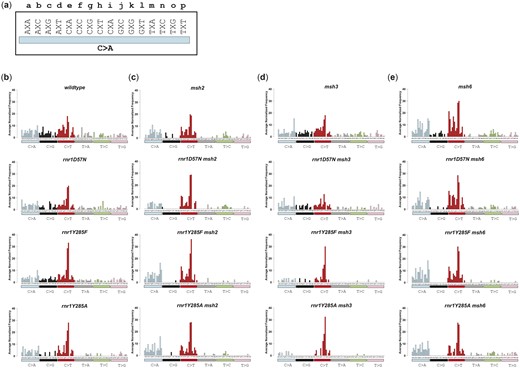
The average number of each SNV as it occurs in unique triplet nucleotide context differs by genotype. Bars are colored according to the 6 different types of SNVs. a) The 16 different triplet contexts are lettered for display purposes. The variant change (C>A, bar) occurs at the middle nucleotide marked X in each triplet context. The same triplet context is repeated for each possible variant in the following panels. b) Wild-type and single rnr1 alleles. c) Genotypes with MSH2 deleted. d) Genotypes with MSH3 deleted. e) Genotypes with MSH6 deleted. Cosine similarity scores (Supplementary Table 22) demonstrate differences among these genotypes. To evaluate specific variants, we averaged the variant frequency in a specific trinucleotide context and calculated the SEM (data not shown).
We also observed a decrease in unique SNVs when rnr1Y285F or rnr1Y285A alleles were paired with msh2Δ, msh3Δ, or msh6Δ. For example, we observed a complete loss of C>G SNVs in all trinucleotide contexts in rnr1Y285A msh3Δ, rnr1Y285A msh6Δ, and rnr1Y285F msh6Δ backgrounds, as noted above (Fig. 3b and Supplementary Table 12). C>G variants rarely occurred in msh2Δ backgrounds, indicating that the replicative polymerases rarely generate these errors when dNTP pools are unperturbed. However, rnr1 single and double mutant profiles revealed distinct changes in the C>G variants, compared to single mshΔ mutants. For example, rnr1Y285A sustained several C>G mutations in multiple trinucleotide contexts, which were also observed in rnr1Y285A msh2Δ. The C>G variants were completely absent in rnr1Y285A msh3Δ and rnr1Y285A msh6Δ, indicating that either Msh2–Ms3 or Msh2–Msh6 can direct the repair of these variants. Thus, different rnr1 alleles paired with different MMR deletions result in distinct mutational fingerprints.
Next, we performed motif analysis to identify larger sequence contexts driving distinct mutational signatures (Figs. 5–7). We were particularly interested in sequence motifs that might define Msh2–Msh3- vs. Msh2–Msh6-mediated substrate specificity and MMR activity. Genotypes were clustered based on the types of variants that were differentially enriched as a function of genotype, using hierarchical clustering as a means of identifying genotype-specific differences (Fig. 5), which we then investigated further (Figs. 6 and 7). It is worth noting that overall, clusters were similar to those observed in Fig. 2, which suggests that unique variants were the main drivers of genotype-specific mutation profiles. We identified specific variants that were differentially enriched by genotype and performed motif analysis (12 base window) to determine whether broader sequence context influenced the occurrence of these variants. We identified several motifs that were positively or negatively enriched in different genetic backgrounds. MMR status appeared to be the primary driver for enrichment. G/C-1 variants within G/C homopolymeric runs were positively enriched in msh3Δ genotypes. In contrast, A/T-1 variants within A/T runs were positively enriched in msh2Δ and msh6Δ genotypes, as were SNVs, especially C>T variants, within several different but related sequence motifs (see examples in Fig. 5).
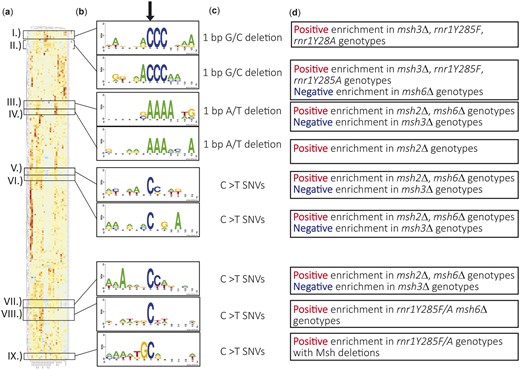
Variants that occur in unique sequence contexts cluster together. Hierarchical cluster analysis of all unique variants within our study by genotype. a) A heatmap displaying enrichment of a given variant between genotypes, with notable clusters boxed. b) Twelve base window motif enrichment on sequence contexts surrounding the notable clusters. c) The type of variant observed in the center of sequence context from B. d) Summary of genotypes showing negative or positive correlation in each cluster.
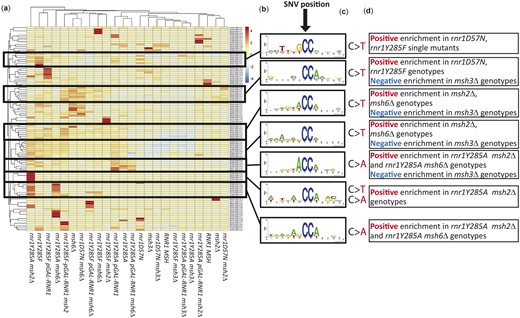
SNVs occur in C–C dinucleotide sequence contexts with differential enrichment between genotypes. a) Hierarchical cluster analysis of all SNVs that occur at CC dinucleotides. Clusters of interest are boxed, labeled by roman numerals. b) Motif enrichment of a 12 base window surrounding the mutated nucleotide was performed using Berkley web logos. The mutated base is at the 7th nucleotide position in all logos, indicated by the arrow. c) The most predominant type(s) of SNV in the cluster are displayed. d) A summary of genotypes that shows negative or positive correlation in each cluster.
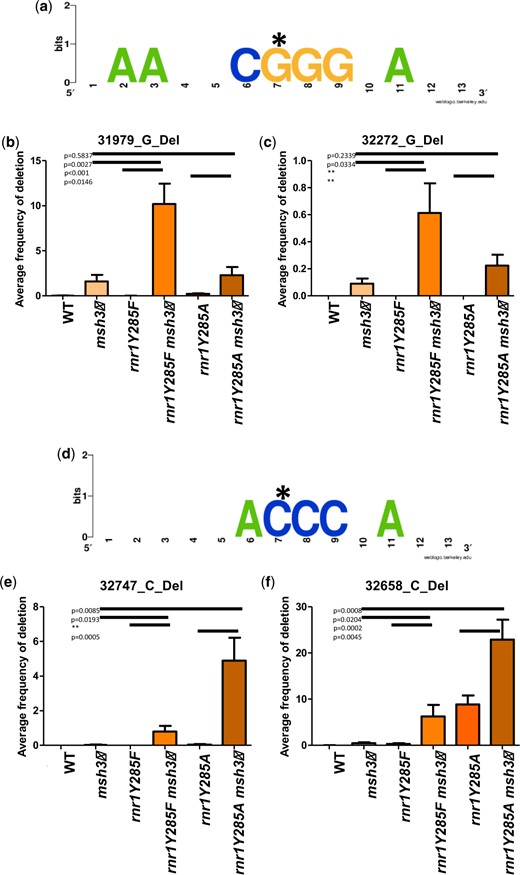
G/C single-base deletions that show synergistic increases in variant frequency in rnr1Y285A msh3Δ genotypes. a) Motif enrichment of a 12-base window surrounding 2 G deletions (starred nucleotide) that are specific to genotypes with msh3Δ. The asterisk indicates the deleted base. b) The average variant frequencies from biological replicates in wild-type, rnr1Y285F/A, and msh3Δ genotypes for the single-base deletion that occurred at position 31979 is plotted. c) The average variant frequencies across replicates for the G deletion at 32272. In both cases (b and c), there are very few events in the single mutants, but significant frequencies in double mutant backgrounds. d) Motif enrichment for 2 C deletions that are specific to genotypes with rnr1Y285F and rnr1Y285A but increase synergistically in double mutants with msh3Δ in combination. The asterisk indicates the deleted base. e) The average variant frequencies across replicates for the G deletion at 32747. f) The average variant frequencies across replicates for the G deletion at 32658. In (e) and (f), this event occurs in rnr1Y285A, but not in rnr1Y285F or msh3Δ. It occurs at increased frequencies in double mutant backgrounds. Error bars indicate the standard error of the mean for frequencies. The P-values were generated by t-tests comparing average frequencies. A double asterisk indicates that a t-test was not possible because one of the genotypes had an average frequency of 0. The percentage of G/C-1 variants in each genotype is: WT—7.7%, msh3Δ—26.3%, rnr1Y285F—4.9%, rnr1Y285F msh3Δ—79.1%, rnr1Y285A—28.9%, rnr1Y285A msh3Δ—94.3%.
Some of the most pronounced differential enrichment between genotypes were SNVs, especially C>A and C>T, that occurred in CC dinucleotide context (Fig. 6). As observed previously (Watt et al. 2016; Lamb et al. 2021), CC/GG dinucleotides bordered by G on either the 5′ side or the 3′ side were frequently mutated in the presence of rnr1 alleles, particularly rnr1Y285F and rnr1D57N. This was not observed with mshΔ alleles. MMR status, especially msh3Δ or msh6Δ, in combination with these rnr1 alleles appeared to modify this bias, resulting in negative enrichment (Fig. 6, I, shaded blue). The majority of SNVs that occurred in other CC dinucleotide contexts were positively enriched in msh2Δ and msh6Δ samples but negatively enriched in msh3Δ (Fig. 6, II, III, IV & V), indicating that Msh2–Msh6 was uniquely required to recognize and direct the repair of misincorporation events in the CC dinucleotide context. Notably, these motifs were A/T-rich, particularly on the 5′ side of the CC dinucleotide. A subset of C>T and C>A variant motifs were uniquely enriched in rnr1Y285A msh2Δ (Fig. 6, VI), indicating either Msh2–Msh3 or Msh2–Msh6 can direct repair.
Motif enrichment analysis also revealed important combinatorial effects on mutation profiles. In double mutants, the combined mutation profiles were not necessarily additive. We observed examples of additive, antagonistic, epistatic, and synergistic effects on mutation profiles. For example, motifs in Box IV are negatively enriched in msh3Δ and positively enriched in rnr1Y285F. These effects appeared to offset each other such that little enrichment was observed in rnr1Y285F msh3Δ. In contrast, the positive enrichment of Box I in rnr1D57N and rnr1Y285F is completely neutralized in the presence of any mshΔ allele. In another example, the rnr1Y285A msh2Δ background was highly enriched in Box VI but is essentially unaffected in either single mutant. We noted a similar effect with rnr1Y285A msh6Δ.
One striking example of nonadditive effects on variant profiles was the synergistic increases in G/C-1 variants within specific sequence contexts when rnr1Y285F/A and msh3Δ alleles were combined (Fig. 7). We previously found that rnr1Y285F and rnr1Y285A single mutants showed an increase in G/C single-base deletions (Lamb et al. 2021). Here, we found that msh3Δ does as well (Fig. 3 and Supplementary Table 12). Individual positions that sustained G/C errors along CAN1 were often msh3Δ specific (Supplementary Table 12) or rnr1Y285F/A specific (Lamb et al. 2021). Notably, the frequency of G/C-1 variants within sequence contexts that contain G or C runs increased synergistically in the rnr1Y285F/A msh3Δ double mutants (Fig. 7). In contrast, G/C-1 variant frequency was neutral or negatively enriched in all other genotypes, consistent with the apparent specificity of Msh2–Msh3 for directing the repair of G/C single-base deletions (Figs. 3 and 5 and Supplementary Table 12). Loss of Msh2–Msh3 resulted in increased G/C single-base deletions in homopolymer runs bordered by G/C-rich sequence on the 5′ side of the run (Fig. 7, a–c). This error in this context occurred rarely in rnr1Y285F/A alone. There was a significant increase in G/C-1 mutations in rnr1Y285F msh3Δ double mutants. In contrast, G/C runs bordered by A/T nucleotides were more prone to mutagenesis in rnr1Y285F/A than in msh3Δ single mutants (Fig. 7, d–f). The frequency of these variants directly bordered by A/T increased synergistically when MSH3 was deleted in the presence of rnr1Y295F/A, but not when MSH6 was deleted, indicating that Msh2–Msh3 has specificity in directing the repair of G/C-1 deletions in repetitive G/C context.
Discussion
Utilizing a CAN1 selection-based deep-sequencing approach (Lamb, et al. 2021), we characterized mutation spectra in mshΔ and rnr1 mshΔ double mutant genotypes. While we likely missed non-inactivating mutations and more significant rearrangements that might occur, the sequencing depth afforded by our approach allowed us to expand our understanding of MMR substrate recognition as well as the combined effects of MMR defects and altered dNTP pools on replication fidelity. By using rnr1 backgrounds that alter the type and frequency of mutations sustained, we revealed previously unrecognized specificities for the MMR initiation complexes, Msh2–Msh3 and Msh2–Msh6. The combinatorial effects that we find highlight the importance of studying mutation signatures in different genetic contexts.
Different mechanisms of mutagenesis result from distinct elevations in dNTP levels
In rnr1D57N msh2Δ, the mutation rate increased 74 times higher than wild type and 3 times above msh2Δ, yet the mutation spectrum of rnr1D57N msh2Δ is closely related to msh2Δ, with the exception of an increase in A/T + 1 insertions in the double mutant (Fig. 3). The same is true of rnr1D57N msh3Δ and rnr1D57N msh6Δ; their mutation spectra are most closely related to those of msh3Δ and msh6Δ, respectively, despite high increases in mutation rates (Fig. 3, Table 1, and Supplementary Table 12). Therefore, the elevated dNTP pools in rnr1D57N, which resulted in a mutation spectrum similar to wild type (Lamb, et al. 2021), with the notable exception of G/C-1 deletions, did not substantially drive the type of mutation generated. The low-frequency variants that accumulate in rnr1D57N were effectively repaired by MMR, in general, and even the absence of MMR did not result in an overt fitness defect in rnr1D57N (Fig. 1d and Supplementary Table 7). We conclude that the balanced dNTP increases in rnr1D57N alter mutagenesis without a remarkable change in mutation spectrum.
The rnr1Y285F allele has a modest effect on mutation rate, yet yielded a distinct mutation spectrum especially when paired with MSH deletions. In fact, the rnr1Y285F mshΔ spectrum closely resembles that of rnr1Y285A mshΔ, despite rnr1Y285A having a higher skew in dNTP pools, a higher mutation rate (Table 1), and a fitness defect (Fig. 1, d and e). We conclude that even modest skewed increases in dNTPs (rnr1Y285F) result in distinct error accumulation, likely due to both a decrease in selectivity of the replicative polymerases and an increase in efficient mismatch extension at the expense of proofreading (Kumar, Abdulovic et al. 2011; Watt et al. 2016). Fig. 8a illustrates an example of 2 different positions in the rnr1Y285A msh6Δ background that are predicted to be mutated at increased frequencies via this mechanism.
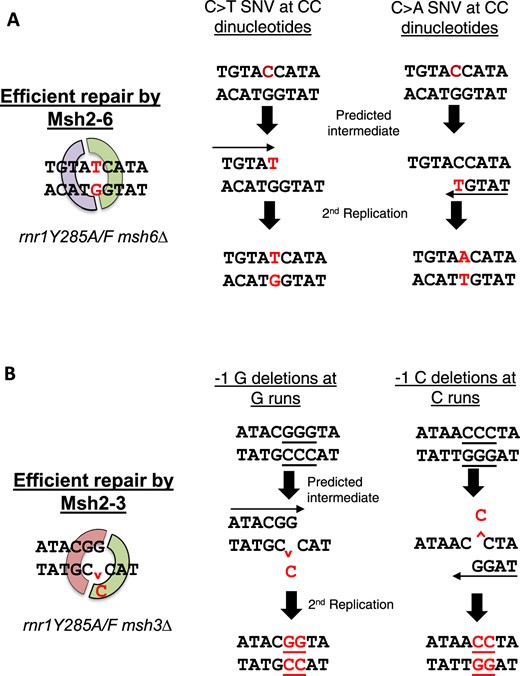
Mechanisms of mutagenesis for the incorporation of errors specific to either Msh2-Msh6 or Msh2-Msh3 repair. The mutated base of interest is represented in red. a) Two examples of sequence context surrounding CC dinucleotides from Fig. 6b, where mis-insertion is due to the nucleotide in excess in rnr1Y285F/A backgrounds. These errors are efficiently repaired by Msh2-Msh6. This specificity becomes apparent when msh6Δ is paired with rnr1Y285F/A alleles. b) Two examples of sequence context from Fig. 7, a and d, where misalignment events occur due to the severely limiting amount of dGTP in rnr1Y285F/A genetic backgrounds. The run where the deletion occurred is underlined. These single-base G/C deletions are efficiently repaired by Msh2-Msh3, but not Msh2-Msh6, a previously unidentified specificity of the repair complex.
The increase in G/C deletions in both rnr1Y285F and rnr1Y285A genotypes can be explained by limiting the levels of dGTP (Fig. 8b). dGTP levels are limiting in both yeast and mammalian cells (Chabes et al. 2003; Wilson et al. 2011; Mathews 2015) and notably led to distinct patterns of mutagenesis when the concentration decreases further, relative to the increase in the other 3 nucleotides, in rnr1Y285F and rnr1Y285A and even in rnr1D57N. This effect is exacerbated by the loss of MMR, especially Msh2–Msh3. Notably, rnr1 alleles that cause increases in dGTP are also found to be extremely mutagenic (Schmidt et al. 2019), highlighting the importance of maintaining the proper level and relative abundance of dGTP.
New insights into MMR specificity
Msh2–Msh3 and Msh2–Msh6 have separate but overlapping DNA substrate specificities, leading to an expanded repertoire of repair. Previous studies, using a variety of reporter assays, have demonstrated that both can recognize and direct the repair of small insertions and deletions (Sia et al. 1997; Flores-Rozas and Kolodner 1998; Harfe and Jinks-Robertson 1999; Kunkel and Erie 2005), but we still have an incomplete understanding of the mechanistic differences in Msh2–Msh3- vs. Msh2–Msh6-directed repair. The deep sequencing reported here highlights previously unreported specificities for these pathways and provides new information about sequence context effects on MMR. Previous studies used single-strand oligonucleotide transformation efficiency to define Msh2–Msh3 and Msh2–Msh6 activities (Kow et al. 2007; Romanova and Crouse 2013). This approach indicated that Msh2–Msh6 preferentially corrects insertions, while Msh2–Msh3 preferentially corrects deletions. We did not observe this bias in our data. Although insertions were relatively infrequent in our data sets, msh3Δ and msh6Δ exhibited similar levels of insertion events (Fig. 3), although msh3Δ exhibited more >1-bp insertions.
By altering dNTP pools, we altered the frequency and types of replication errors generated by DNA polymerases, revealing new substrate specificities for Msh2–Msh3 and Msh2–Msh6. It was striking how the mutation profiles for msh3Δ and msh6Δ clustered into such distinct groups, in terms of both the types of variants observed and the sequence contexts in which they occurred. While G/C SNVs are common in wild-type backgrounds, G/C-1 deletions are relatively rare, making it difficult to determine the relative efficiencies of MSH complexes in repairing this type of error. However, elevating the dNTP pools to any extent increased the proportion of G/C-1 deletions, allowing us to assess MMR efficacy in their repair. In particular, the meta-analysis of our dataset showed most single-base deletions in rnr1Y285F, rnr1Y285A, and msh3Δ occurred in G/C rich contexts, especially homopolymeric runs (Figs. 7 and 8b). The double mutants rnr1Y285F msh3Δ and rnr1Y285A msh3Δ exhibited mutation profiles that were completely dominated by G/C-1 deletions. Therefore, Msh2–Msh6 was not able to compensate for the loss of Msh2–Msh3 for the repair of G/C-1 deletions within G/C-rich sequence contexts, despite the fact that both complexes have been implicated in directing the repair of single-base deletions (Meier et al. 2018). This suggests a previously unexplored role of Msh2–Msh3 in promoting replication fidelity within G/C-rich genomic regions. It will be interesting to see how different MLH complexes contribute to this specificity. Previous work has indicated that 2 MLH complexes, Mlh1–Pms1 and Mlh1–Mlh3, are important for repair of deletion mutations (Romanova and Crouse 2013).
Similarly, SNVs at GG/CC dinucleotides were more prevalent in rnr1D57N and rnr1Y285F backgrounds than in wild type (Figs. 6 and 7a). We demonstrated that mutations in these G/C-rich patches were enriched in msh2Δ and msh6Δ backgrounds but depleted in msh3Δ, indicating that Msh2–Msh6 directs more efficient repair of mutations in GG/CC dinucleotides than Msh2–Msh3. GG dinucleotides are mutated as a signature mutation in colorectal cancer (Rubin and Green 2009), cancers which are defined by defects in MMR. Mutations at CC dinucleotides are also found in human lung cancer (Greenman et al. 2007; Lee et al. 2010) and could be generated due to defects in MMR and elevations in dNTP levels in combination. Interestingly, the combination of overexpression of the RNR R2 subunit and deletion of MSH6 caused a synergistic increase in lung carcinogenesis in a mouse model, although no link with altered dNTP pools was established (Xu et al. 2008).
Sequence context analysis indicated that repetitive homoplymeric sequences were the strongest predictor of both indels and SNVs. Previous work found specific sequence context effects for human Msh2–Msh6 (hMsh2–hMsh6) activation in vitro (Mazurek et al. 2009). Mazurek et al. (2009) found that mispairs surrounded by symmetric 3′ purines were preferentially bound by hMsh2–hMsh6. These substrates also enhanced activation of hMsh2–hMsh6 ATPase activity. Both effects were predictive of enhanced repair and were hypothesized to increase the flexibility of the DNA substrate to allow efficient MSH-DNA complex formation. Our deep sequencing of can1 did not reveal a strong Msh2–Msh6 bias for these sequence contexts. There was a subset of mispairs surrounded by 3′ purines (trinucleotide contexts e, g, m, and o, Fig. 4) that were enhanced in the absence of MSH6, but the effect was relatively small (∼2 times increase) and was not systematic. In all genotypes, the greatest predictor of an SNV appeared to be the presence of dinucleotide repeat within the trinucleotide context (GG, CC, TT, or AA). As previously noted (Mazurek et al. 2009), we observed no distinct broader sequence context implicated in directing MMR beyond homopolymeric runs (Figs. 5–7) although we did note the presence of surrounding A’s in our motif analysis, which may be important for increasing DNA flexibility and bending by MSH complexes.
There are few strand-specific effects from altering dNTP levels (Buckland et al. 2014), but numerous studies have indicated that MMR is more efficient on the lagging strand (Pavlov et al. 2003; Kow et al. 2007; Lujan et al. 2012). However, Msh2–Msh3 does not appear to have a lagging strand bias and may, in fact, preferentially act on the leading strand (Kow et al. 2007). This leads us to hypothesize that Msh2–Msh3 may have greater specificity for lagging strand DNA repair. Our targeted sequencing approach could be applied to strains with CAN1 in the reverse orientation to explore the differential activity and/or specificity of Msh2–Msh3 and Msh2–Msh6 on leading vs. lagging strands. This may be due to distinct interactions of Msh2–Msh3 vs. Msh2–Msh6 with MLH complexes (Kow et al. 2007; Iyer et al. 2010; Kadyrova et al. 2020) or PCNA (Lau et al. 2002; Iyer et al. 2010).
Pairing elevations in dNTP levels with MMR deletions led to increased mutation rates and distinct mutation spectra, similar to previous observations specifically with msh2Δ. However, when measuring the rate of canavanine resistance in rnr1Y285A msh2Δ and rnr1Y285A msh6Δ backgrounds, we observed substantially lower colony numbers under permissive conditions, indicating reduced fitness even under conditions when all cells should be able to grow. Reduced fitness of rnr1Y285A msh2Δ and rnr1Y285A msh6Δ was also seen in SGA analysis and in tetrad dissections, consistent with the phenomenon of error extinction where the threshold of mutation rate that allows wild-type cellular fitness is surpassed (Williams et al. 2013; Herr et al. 2014; Schmidt et al. 2017). A similar growth defect in rnr1Y285A msh2Δ was noted in previous work (Watt et al. 2016) and other rnr1 alleles combined with msh2Δ also exhibited growth defects (Schmidt et al. 2019). We expect that the fitness defects we observe in the absence of selection would also reduce the number of cells that are able to grow under the selective conditions of mutation rate experiments, resulting in mutation rates that are underestimates (Table 1). Our results support a model in which MMR protects cellular fitness in the presence of rnr1Y285A. This could be by reducing the level of mutagenesis to avoid mutation-induced extinction (Herr et al. 2014). Alternatively, it is possible that the rnr1Y285A msh2Δ combination results in a cell cycle defect, as observed with pol3-01 (Datta et al. 2000). In this context, it is intriguing that the SGA screens identified synthetic effects between rnr1Y285F/A and several genes involved in mitosis.
Application to mutation signatures in human cancer
The msh2Δ, msh3Δ, and msh6Δ mutation spectra all had features of MMR deficient human tumor samples (Alexandrov et al. 2013). Notably, the msh6Δ spectrum in our study closely resembles that of Msh6−/− in a HAP1 cell line (Zou et al. 2018). The percentage of substitutions and indels in the msh6Δ mutation spectrum is consistent with what is seen in a Msh6−/− cell line. While T>C variants did not dominate the yeast msh6Δ mutation signature as it did in the Msh6−/− cell line, the overall frequency and proportion of T>C changes did increase significantly. These data indicate that mutation signatures developed through defined mutations and deletions in Saccharomycescerevisiae will be broadly applicable to mammalian systems. Mutation signatures from Caenorhabditiselegans also resemble human cancer signatures, albeit with some minor discrepancies (Meier et al.2014, 2018). We note that C. elegans lacks an MSH3 homolog, which is present in both yeast and humans (Denver et al. 2005).
Mutation signatures observed in human cancers are routinely used to predict mechanisms of tumorigenesis. We determined cosine similarity scores for our SNV trinucleotide context profiles and the COSMIC SBS dataset (Alexandrov et al. 2020) (Supplementary Fig. 5 and Supplementary Table 23). Overall, the C>A and C>T changes appeared to drive the clustering. The majority of our samples formed a distinct cluster. The exceptions were rnr1Y285F msh3Δ, rnr1Y285A msh3Δ and rnr1Y285A pGAL-RNR1 msh3Δ, which formed a smaller cluster with the COSMIC signatures SBS6 and SBS15. SBS6 and SBS15 also have high cosine similarity scores with essentially all genotypes except wild type, msh3Δ, and rnr1D57N msh3Δ. SBS6 most commonly occurs in colorectal and uterine cancers and is associated with defective MMR. It is possible that elevations in dCTP and dTTP contribute to this mutation signature in human cancers leading to synergistic increases in these types of mutations in the absence of certain MMR genes. SBS15 is characterized by C>T SNVs within NpCpG sequences in lung and stomach cancers with unknown origin. The origin of these cancers could be in part, due to defects in MMR coupled with skewed increases in dCTP and dTTP, consistent with the increased frequency of these SNVs at dinucleotides observed in rnr1Y285F/A msh3Δ backgrounds.
SBS20 showed high similarity with msh6Δ, rnr1D57N msh6Δ, rnr1Y285F msh6Δ, and msh2Δ. This signature is associated with combined MMR and POLD1 mutations; the latter is deficient in polymerase δ proofreading activity. This indicates that reduced replication fidelity resulting from either increased dNTP pools or decreased proofreading combine with MMR defects to generate similar mutation signatures. We also noted similarity between SBS24, which is associated with aflatoxin exposure, and msh6Δ and msh2Δ individually or in combination with rnr1Y285F or rnr1Y285A. Several genotypes were similar to SBS94 (msh2Δ, msh6Δ, rnr1D57N msh6Δ, and rnr1Y285F pGAL msh6Δ) and SBS23 (msh2Δ, msh6Δ, and rnr1D57N msh6Δ), both of which are of unknown etiology.
In addition, we also compared mutation signatures from our study to the COSMIC insertion and deletion (ID) signatures (Alexandrov et al. 2020). A major caveat to comparing CAN1 ID mutations to human mutation signatures is the lack of homopolymeric sequences within CAN1. Nonetheless, within the sequence contexts available, we noted that increased G/C single-base deletions in the G/C context were present in COSMIC ID signatures ID3, ID7, ID9, and ID15. The proposed etiology of ID Signature 3 is cigarette smoking, ID7 is MMR defects, and ID9 and ID15 have unknown etiology. Elevated dNTP levels have not been part of a clinical diagnosis but skewed increases in dNTPs likely also contribute to these signatures of unknown etiology.
Our results highlight the importance of considering altered dNTP pools and combinatorial effects of genetic backgrounds, when defining the source of tumor mutation signatures.
Data availability statement
All strains and plasmids are available upon request. All CAN1 sequences were uploaded to SRA BioProject PRJNA785873. SAFE analysis can be found at https://github.com/baryshnikova-lab/safepy. All mutation profile and SGA data are also available in the supplementary tables. Representative code is available at: https://github.com/nalamb/CAN1-Paper.
Supplemental material is available at GENETICS online.
Acknowledgments
We gratefully acknowledge Dr. Anastasia Baryshnikova for her help with the SAFE analysis. We thank the UB Bioinformatics and Genomics Core for their expertise performing the sequencing in this study.
Funding
NAL is a University at Buffalo Presidential Scholar. This work was supported by the American Cancer Society (RSG-14-2350-01) to JAS. JAS is an ACS Research Scholar. JAS is also grateful for support from the University at Buffalo’s Genome, Environment and Microbiome Community of Excellence. This work was also supported by a grant from the Canadian Institutes of Health Research (FDN-159913 to GWB).
Conflicts of interest
None declared.
